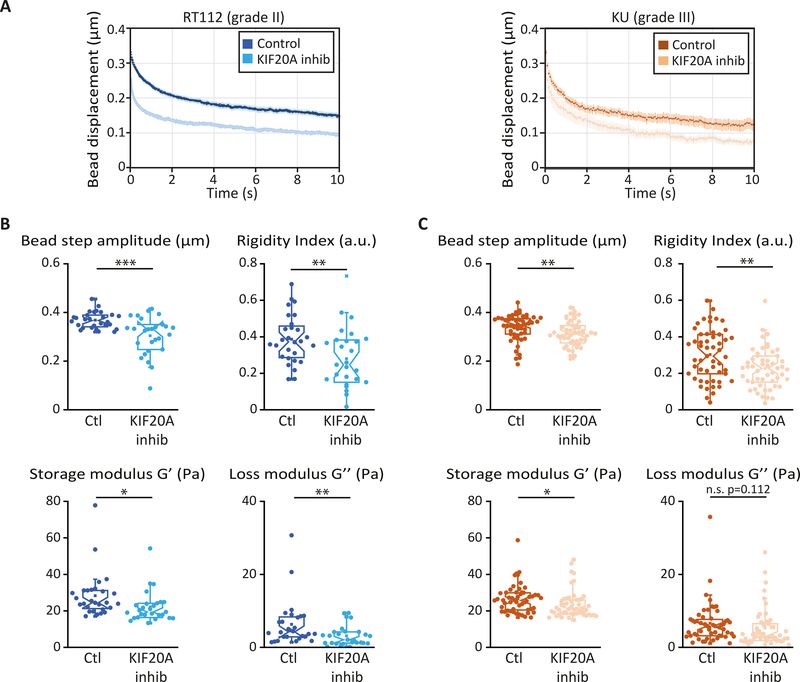
Figure 2: KIF20A inhibition softens the cytoplasm of both low and high grades bladder cancer cells.
(A) Average intracellular relaxation curves for control RT112 (blue) and KU (orange) cells for control and for cells treated with the KIF20A inhibitor paprotrain (light blue, light orange). (B-C) Rigidity index, bead step displacement, storage modulus G’ and loss modulus G” in control and KIF20A inhibited RT112 cells (B) or KU cells (C). Data are averages from N=36 and 21 cells for control and KIF20A inhibited RT112 cells and from N=60 cells in both control and KIF20A inhibited KU cells. Error bars represent standard errors. P values are determined from Student’s t- test for unpaired samples with respect to control cells (*** p<0.001; ** p< 0.01; * p<0.05; and n.s. p>.05 not significant).

