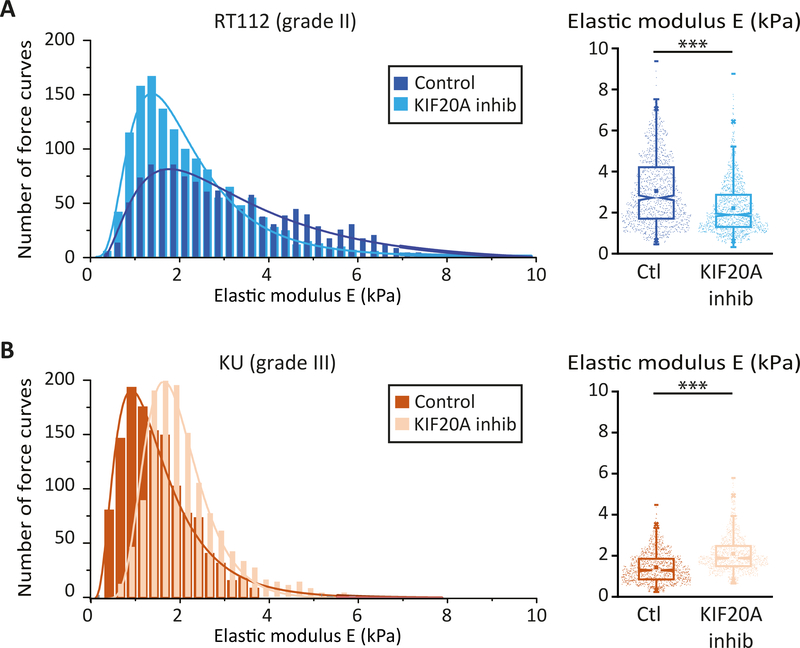
Figure 3: KIF20A inhibition softens the cortex of low-grade bladder cancer cells but stiffens the cortex of high grade bladder cancer cells.
(A) (Left) Distribution of the elasticity E measured by AFM indentation experiments for control grade II RT112 cells (black) and for RT112 cells treated with the KIF20A inhibitor (grey). (Right) Averaged elasticity of control RT112 cells (blue) and RT112 cells treated with the KIF20A inhibitor (light blue). (B) Same as (A) for KU cells. Data are from N=60 cells per condition and for each cell about 25 force vs. distance curves were acquired. Distributions are fitted with a log normal distribution. Error bars represent standard errors. p values are determined from Student’s t test for unpaired samples with respect to control cells (*** p<0.0001; ** p<0.001; and * p<0.01).

