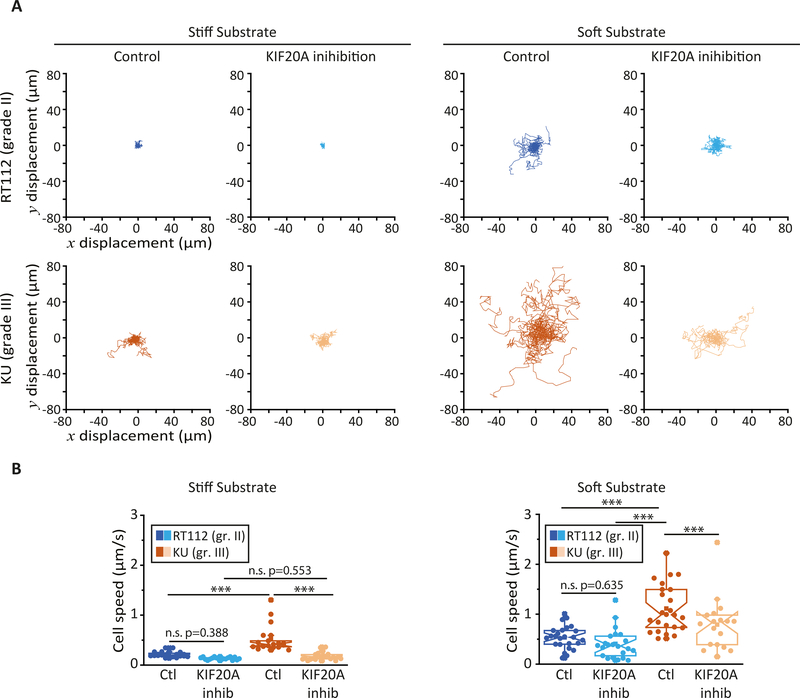
Figure 4: KIF20A inhibition reduces individual bladder cancer cell motility.
(A) Bright-field images of randomly migrating RT112 cells (upper panels) and KU cells (lower panels) plated on stiff (glass, left) and soft (G=500 Pa polyacrylamide hydrogel, right) substrates at t=0 hr and t=4 hrs time points. Cell tracks are shown in color in the t=4hr images (see supplementary movies S1–S4. Scale bar, 100 μm. (B) Average cell speed measured from images acquired every 5 min for 5–8 hours Error bars represent standard error mean. On soft substrates, data are from N=25 and 22 control and KIF20A inhibited RT112 cells respectively, and N=24 and 18 control and KIF20A inhibited KU cells respectively. On stiff substrates, N=20 and 18 control and KIF20A inhibited RT112 cells respectively, and N=39 and 22 for control and KIF20A inhibited KU cells respectively. Error bars represent standard errors. p-values are determined from Student’s t-test for unpaired samples (*** p<0.0001; ** p<0.001, * p<0.01).

