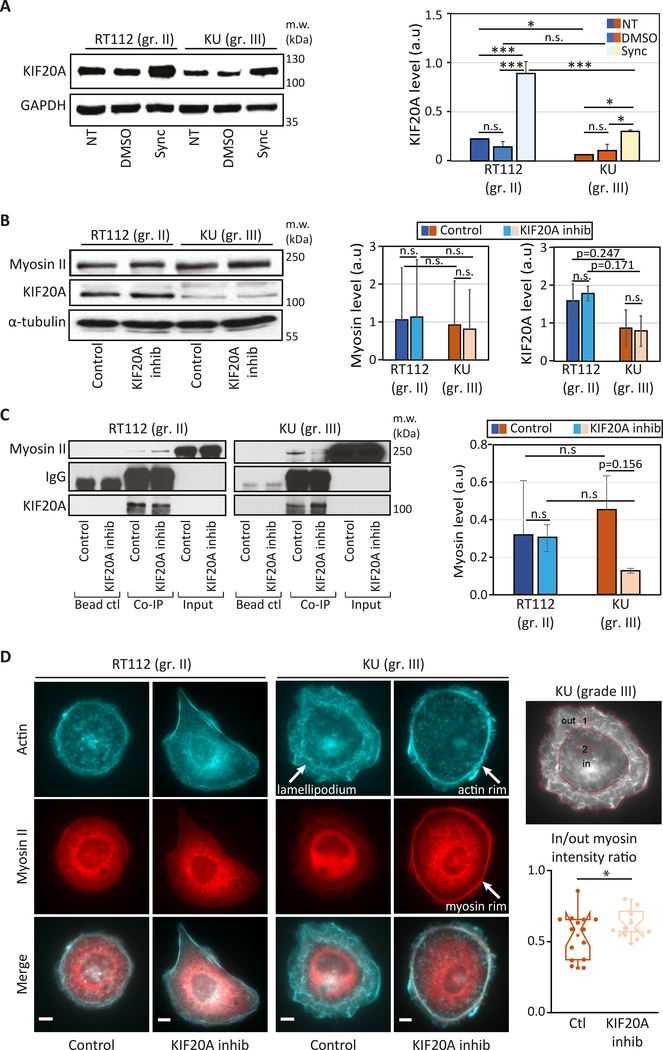
Figure 5: KIF20A interacts with myosin II in bladder cancer cells and its inhibition affects cortical acto-myosin organization specifically in high grade bladder cancer cells.
(A) (Left) KIF20A expression in non-treated (NT), control (DMSO) or synchronized in mitosis (Sync) RT112 and KU cells (top). (Right) Quantification of the blots showing the normalized expression of KIF20A relative to the loading control (GAPDH). Error bars represent standard deviation of N=2 independent experiments. p-values are determined from Student’s t-test for unpaired samples (** p<0.005, * p<0.05, n.s p> 0.05 not significant). (B) (Left panel) Levels of myosin II and KIF20A in RT112 and KU cells treated with DMSO (control) or with 50 μM paprotrain (KIF20A inhibition). (Right panel) The graph shows quantification of the KIF20A and myosin band intensities normalized by the loading control (GAPDH or tubulin). Error bars represent standard deviation of N=3 independent experiments. (C) Interaction between myosin II and KIF20A shown by co-immunoprecipitation in control cells treated with DMSO and in cells treated with the KIF20A inhibitor (paprotrain 50 μM) in both RT112 and KU cells. (Left panels) Endogenous Myosin II is pulled down using a KIF20A antibody. Myosin II bound to KIF20A and KIF20A were revealed by western blot analysis using an anti-Myosin II antibody and an anti-KIF20A antibody respectively. Note that myosin II is detected in the input due to its high expression levels as opposed to KIF20A. (Right panel) Quantification of the myosin II/KIF20A interaction with respect to the total amount of KIF20A showing a reduced interaction after KIF20A inhibition in KU cells. Error bars represent standard deviation of N=3 independent experiments. p-values are determined from Student’s t-test for unpaired samples (** p<0.005, * p<0.05, n.s p> 0.05 not significant). (D) Actin and myosin II localization in bladder cancer cells. (left) Immunofluorescence images of actin (cyan, top), myosin II (red, middle) and merged actin/myosin II (bottom) for RT112 cells (right panels) and KU cells (left panels) treated with DMSO (control) or with the KIF20A inhibitor. Scale bars, 10 μm. (right) Myosin distribution was quantified by measuring the myosin fluorescence from an outer (lamellipodium, ‘1’) region and an inner (central, ‘2’) region (left). Normalized intensities plotted for control and KIF20A inhibited KU cells (right). Error bars represent standard errors (N=16 and 15 cells for control and KIF20A inhibited cells respectively). p-values are determined from Student’s t-test for unpaired samples (* p<0.05).

