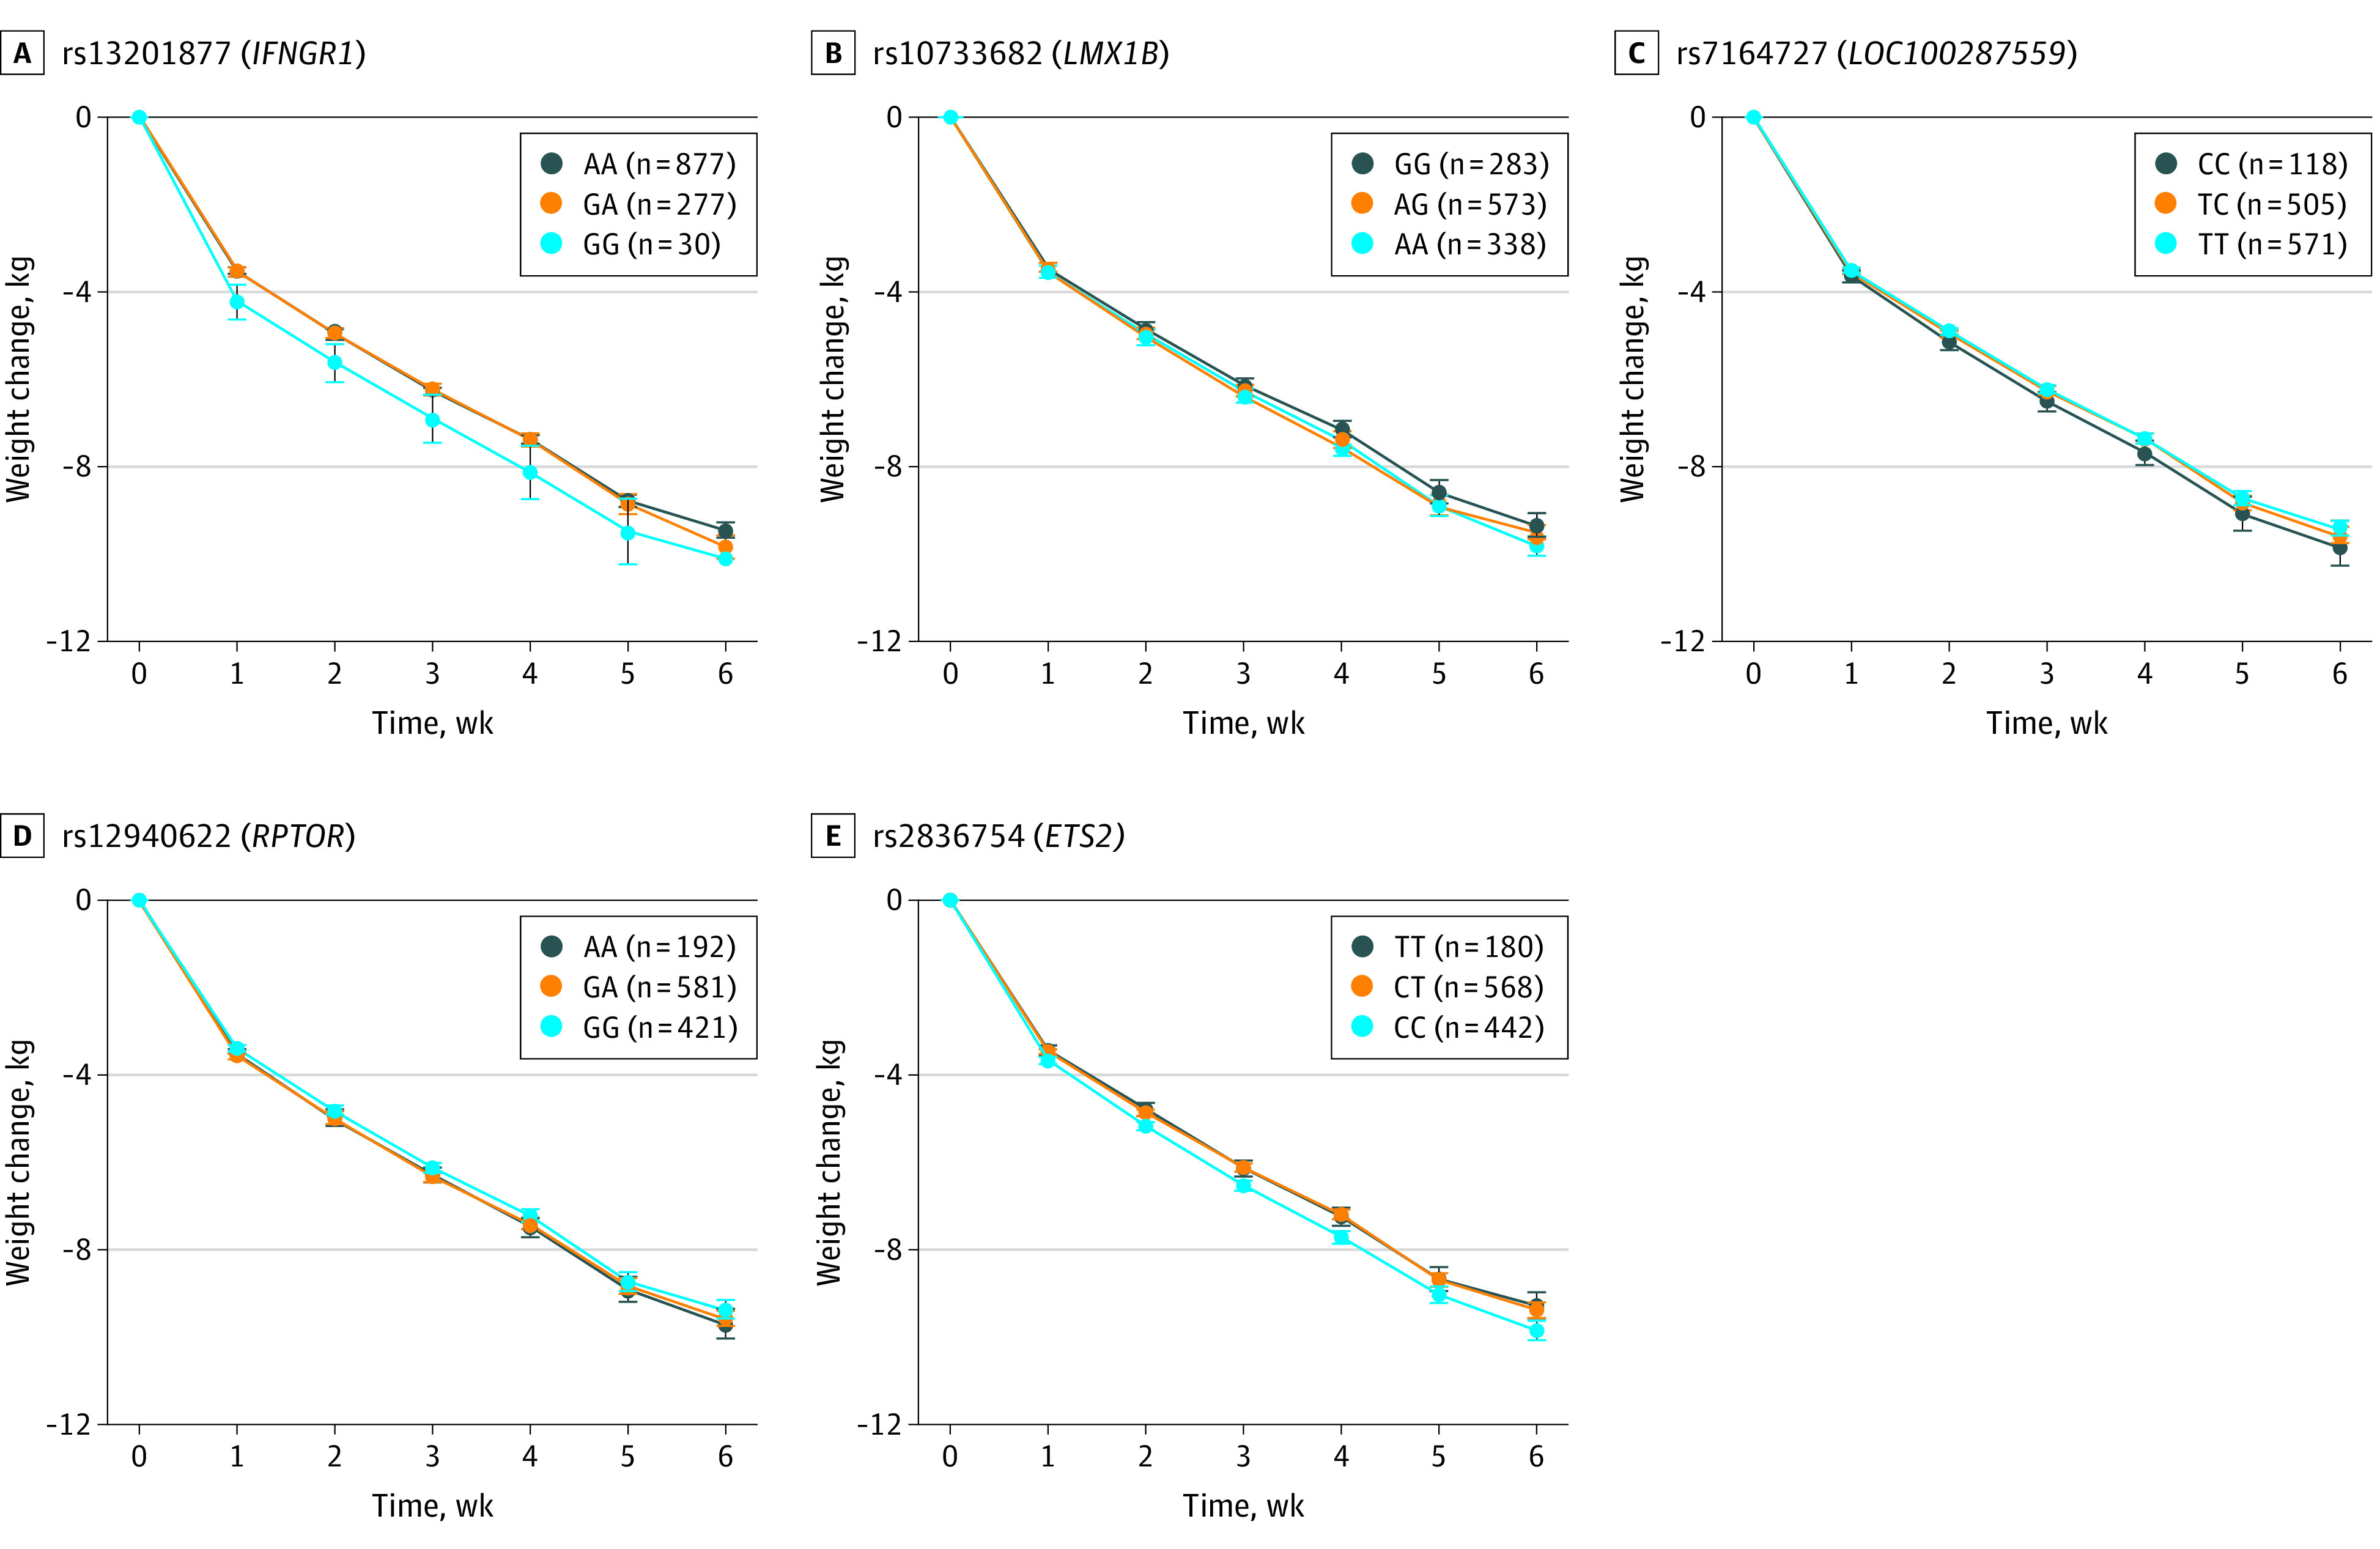
Figure 2. Changes in Body Weight and Genotypes.

Mean change in age- and sex-adjusted body weight between weeks 0 and 6 and week 0 for carriers of the different genotypes of the SNVs rs13201877 (A), rs10733682 (B), rs7164727 (C), rs12940622 (D) and rs 2836754 (E). A indicates adenosine; C, cytosine; G, guanine; and T, thymine. Parenthetical values indicate the number of children included in the analysis. Error bars indicate the 95% CI.
