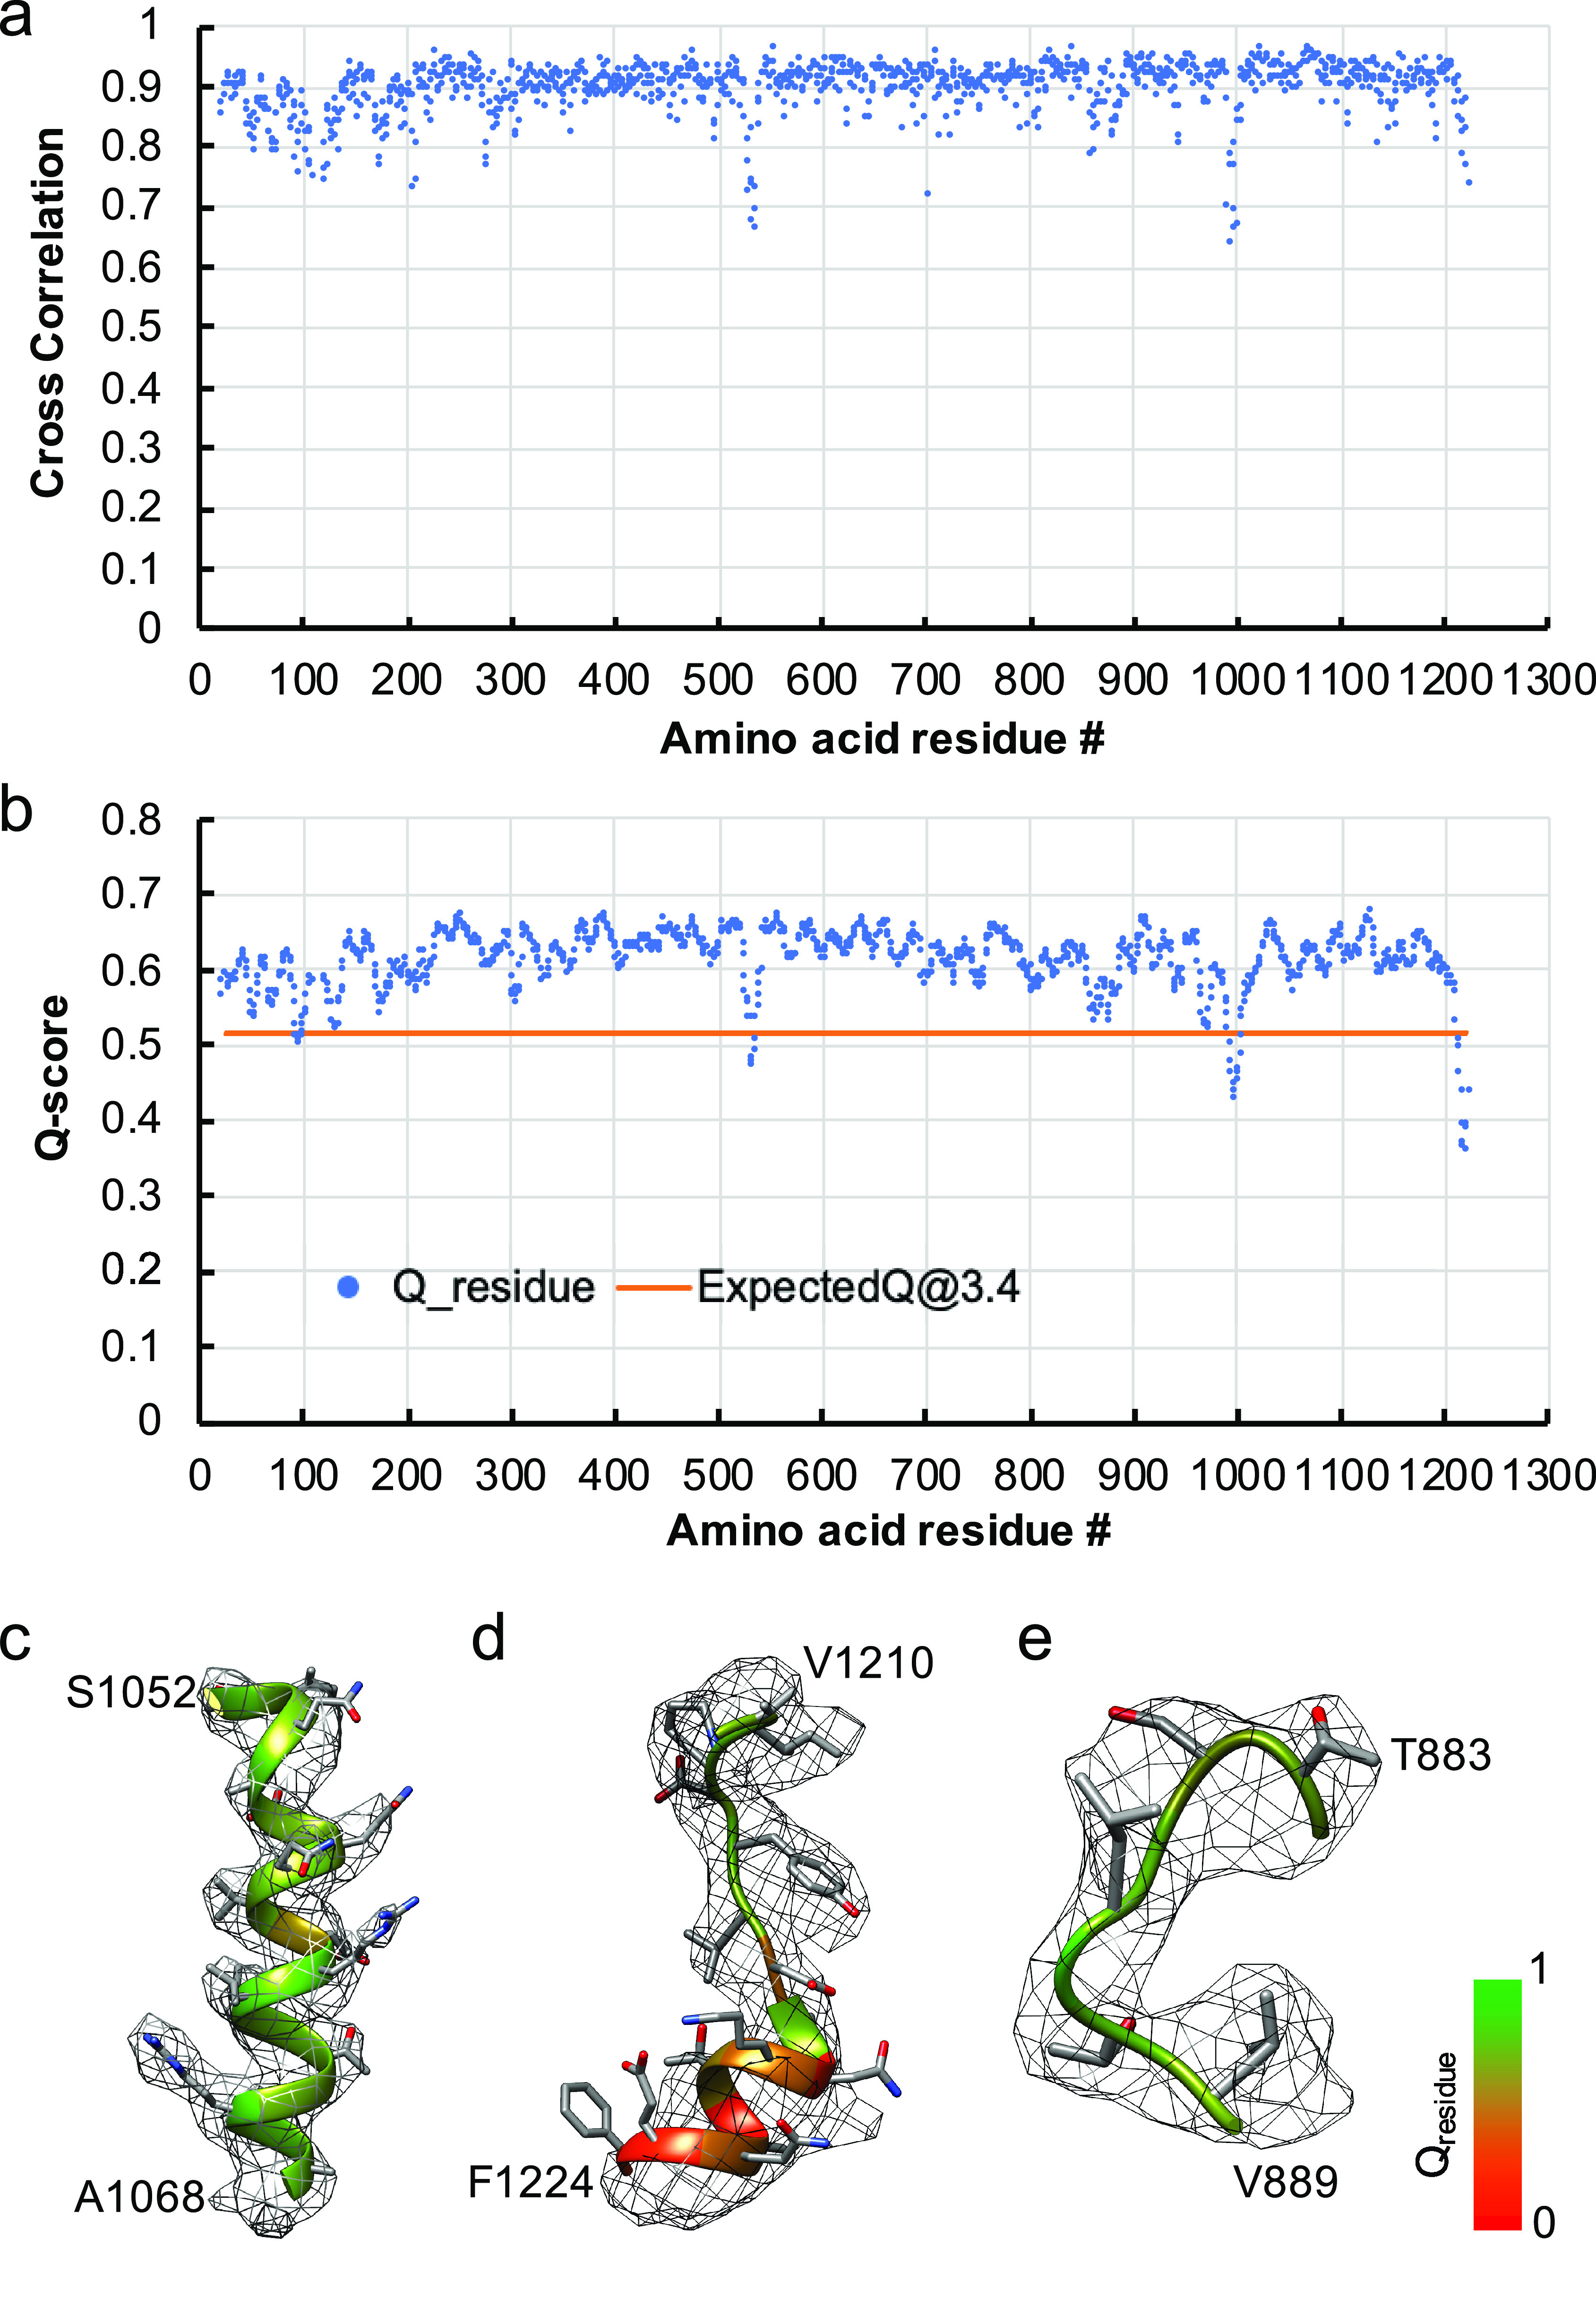
Fig. 2.

Model validation of the HCoV-NL63 coronavirus spike glycoprotein protomer. (a) Per-residue cross-correlation coefficient between the model and 3.4-Å map. (b) Q-score for each amino acid residue in the model and 3.4-Å map; the orange line represents the expected Q-score of 0.52 at 3.4-Å resolution based on the correlation between Q-scores and map resolutions (Pintilie et al., 2020). (c–e) Examples of different regions of the map with different resolvability: (c) well-resolved, (d) poorly-resolved; (e) residues not resolved in the previous biochemically purified HCoV-NL63 spike protein structure (PDB ID: 5SZS) and thus their model built de novo here. The model is shown as ribbon, with residue Q-scores annotated in colors. The higher Q-score indicates better resolvability.
