Fig. 3.
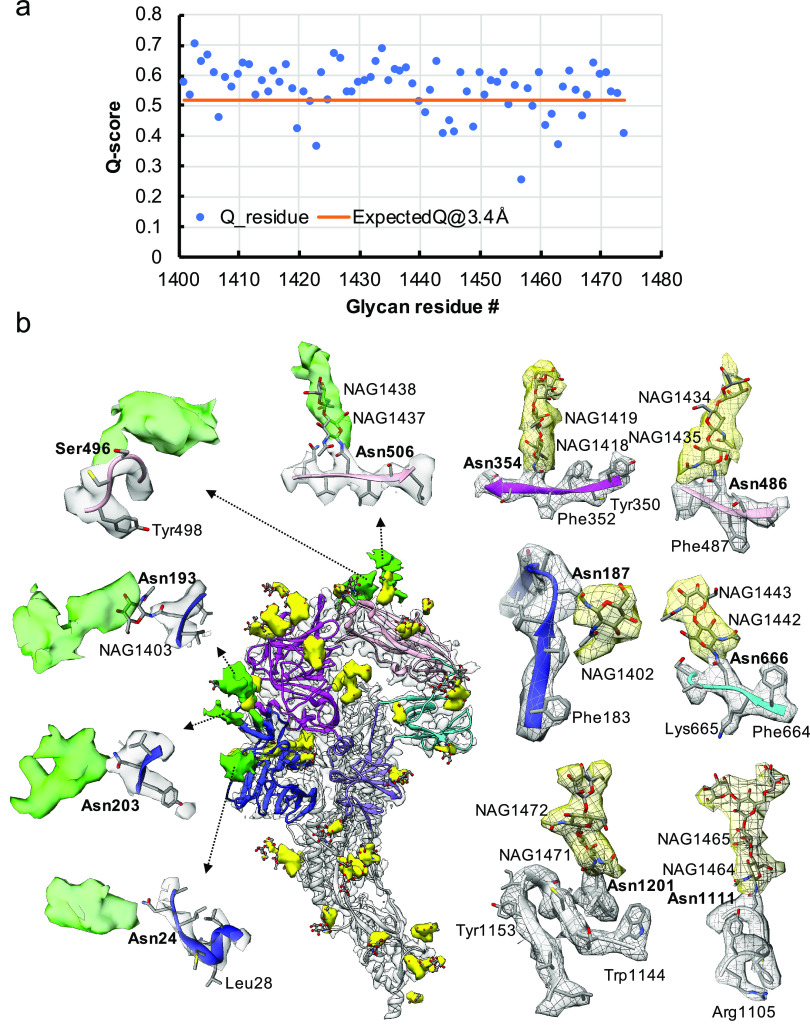
Resolvability of glycans. (a) Q-scores analysis for each glycan residue (# starting from 1401) in model and map; the orange line represents the expected Q-score of 0.52 at 3.4-Å resolution based on the correlation between Q-scores and map resolutions of amino acid residues (Pintilie et al., 2020). (b) Highlights on several glycans. Green: Positive difference density between our and previous map (EMD-8331) suggesting extra glycan densities; Yellow: glycan densities found both in our map and in the previous study. The glycan models were derived from (PDB ID: 5SZS).

