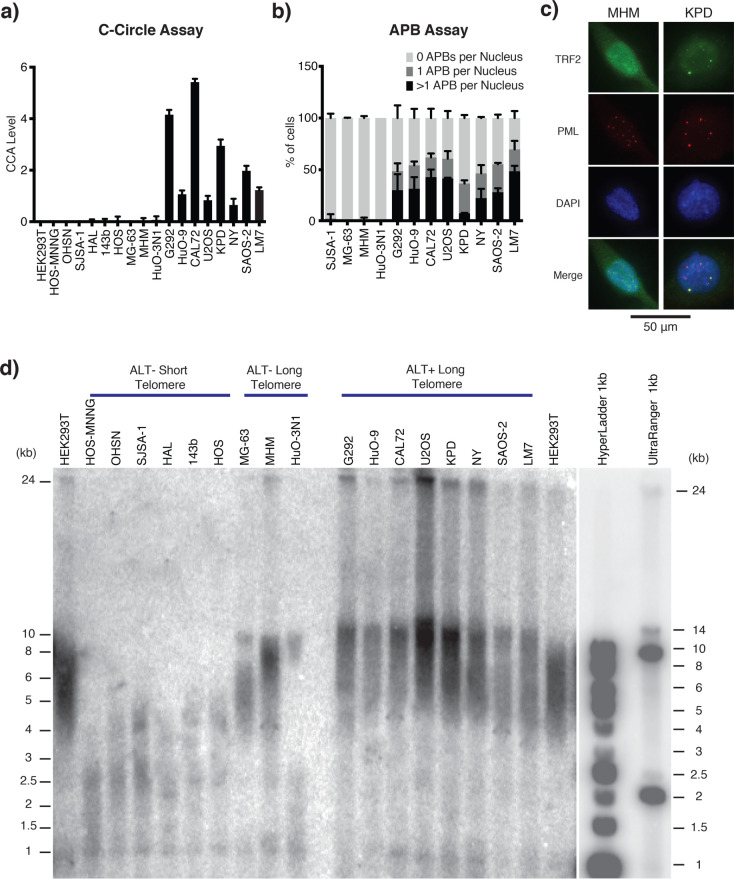
Figure 1.
Characterization of telomere status in osteosarcoma cell lines. (a) C-Circle assay (CCA) Level. Graph shows the CCA level calculated by subtracting the phi-29 polymerase NTC by the phi-29 polymerase free control NTC (see the “Material and Methods” section). A sample is then considered ALT+ if its CCA level lower error bar is >0. Data is represented as a mean of three independent experiments. Error bars show standard deviation. Dot blot result of phi-29 polymerase is shown in Figure S-1a. (b) APB assay for the osteosarcoma cell lines with long telomeres. APBs were scored as a direct colocalization between TRF2 and PML foci. The graph shows the mean percentage of cells containing 0, 1, or >1 APBs in their nuclei for three independently prepared samples of >50 cells. Error bars show standard deviation. (c) Representative immunofluorescence images showing the presence/absence of APBs in the KPD and MHM cell lines, respectively. TRF2 was stained green, and PML bodies were stained red. Yellow foci (colocalization of green and red foci) in the merge panel represent APBs. A 50 μm scale bar is shown. Representative images of all tested cell lines are shown in Figure S-2. (d) Telomere Southern blot of osteosarcoma cell lines. Terminal restriction fragment length analysis of genomic DNA digested with HinfI and RsaI and hybridized with a telomeric TTAGGG probe. A less exposed image of the DNA ladders is shown on the right. ALT-negative cell lines tend to have shorter telomeres than those of HEK293T, while ALT-positive cell lines tend to have longer telomeres than those of HEK293T, which are extremely heterogeneous in length. Digital analysis of telomere length is shown in Table 1.

