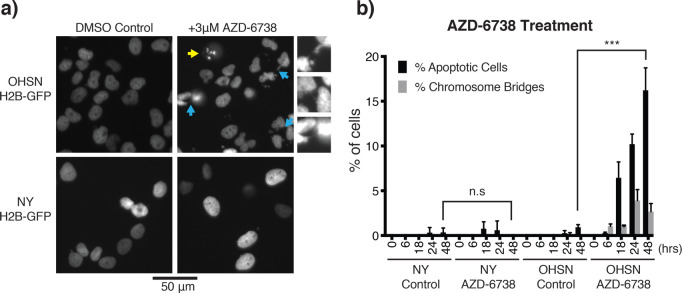
Figure 5.
ATRi-induced chromosome bridges and apoptotic cell death in osteosarcoma with short telomeres. (a) Representative images of OHSN and NY cell lines tagged with H2B-GFP. Yellow arrow shows apoptotic cell. Cyan arrows show chromosome bridges, which are enlarged and shown on the right of the panel. A 50 μm scale bar is shown. (b) Quantification of apoptotic cells and chromosome bridges over 48 h. Cells were treated with vehicle or AZD-6738 and were imaged at 6, 18, 24, and 48 h to count number of apoptotic cells and chromosome bridges from randomly selected samples of at least 200 cells. Graph shows mean percentage of cells classified as apoptotic or containing chromosome bridges for three independent experiments. Error bars show standard deviation. Short telomere cell line OHSN has significantly more apoptotic cells after AZD-6738 treatment compared to control cells, while no significant difference is seen for the long telomere ALT-positive cell line NY (Student’s t test; ***, p < 0.001).

