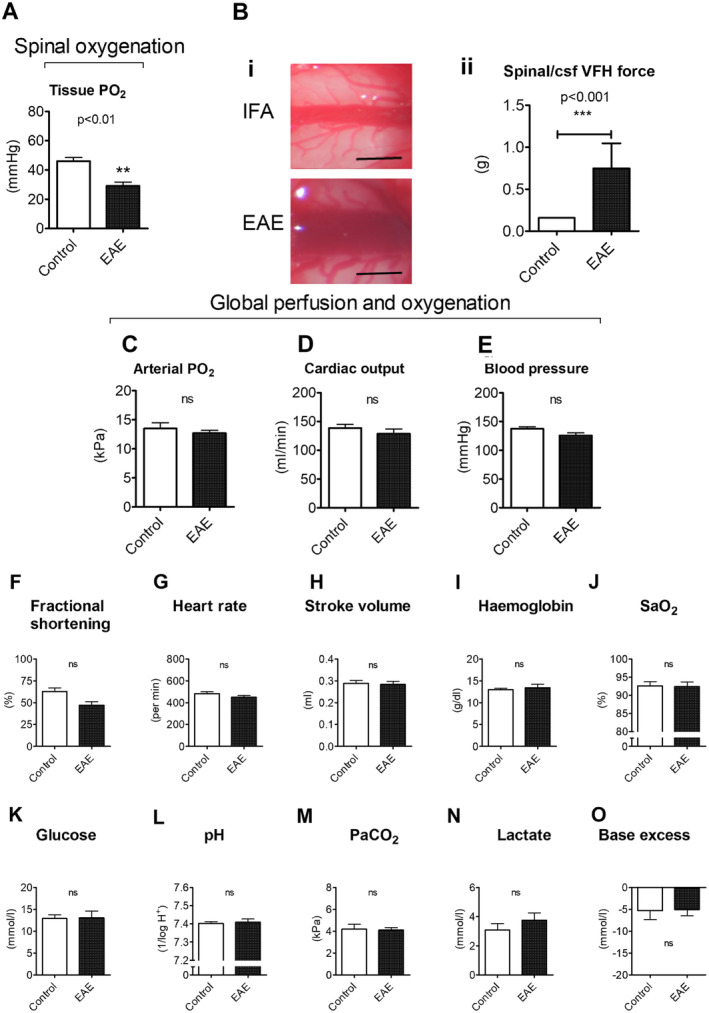
Figure 1.

Spinal oxygenation, edema, and global cardiorespiratory function. (A) Shows the spinal cord tissue PO2 measured by a fiber‐optic oxygen‐sensitive probe. (B) The i and ii show representative images of the exposed spinal cord and graphical representation of spinal edema in EAE and IFA controls. (C) Shows arterial PO2 obtained by blood gas analysis. Echocardiography‐derived cardiac output and carotid arterial mean blood pressure measurements are depicted in (D) and (E), respectively. Echocardiography‐derived fractional shortening, heart rate and stroke volume are shown in panels (F–H). Additional determinants of oxygen delivery, glycemic status, and global indicators of organ perfusion are shown in (I, J, K, L, M, N, and O, respectively). Data presented as mean ± SEM. **p < 0.01, ***p < 0.001, unpaired t‐test with Bonferroni correction (A: EAE: n = 8; IFA: n = 7; C–H: EAE: n = 8; IFA: n = 6; I–O: EAE: n = 8; IFA: n = 7), Mann–Whitney U test (Bii: EAE: n = 20; IFA: n = 6). CSF = cerebrospinal fluid; EAE = experimental autoimmune encephalomyelitis; IFA = incomplete Freund’s adjuvant; PO2 = partial pressure of oxygen; PaCO2 = partial pressure of carbon dioxide; SaO2 = oxygen saturation; VFH = Von Frey Hairs.
