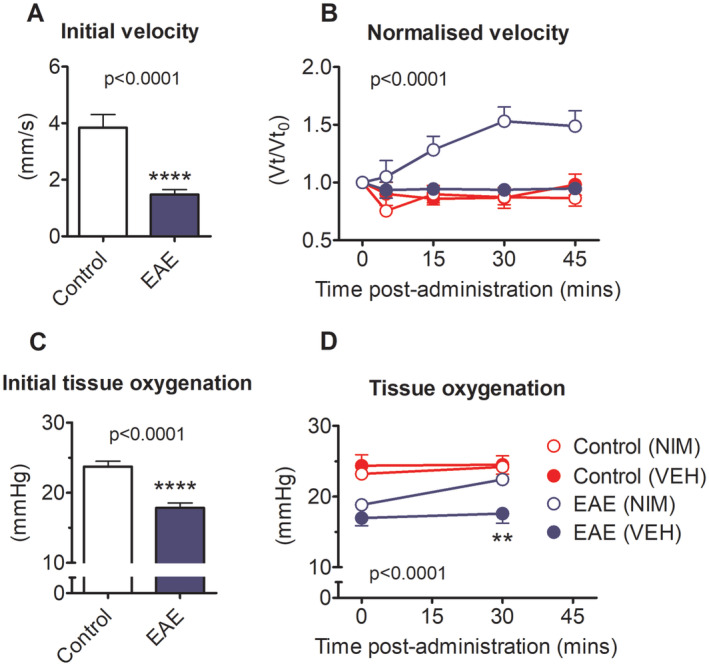
Figure 4.

Effect of nimodipine on spinal cord blood flow and oxygenation. (A) Shows initial SCBF velocity in animals with EAE or controls. (B) Shows changes in velocity normalized to each animal’s baseline velocity following treatment with either vehicle or nimodipine. Velocities were measured in the dorsal spinal vein of anesthetized rats and revealed by fluorescent microspheres suspended in the plasma and viewed through the intact dura. (C) Shows spinal tissue oxygenation in control animals compared with animals with EAE. (D) Shows the change in spinal oxygenation in animals with EAE or controls prior to and following the administration of nimodipine or vehicle. Nimodipine improves spinal oxygenation in animals with EAE from hypoxic to normoxic levels. Data presented as mean ± SEM. Stated p values reflect the outcome of an unpaired t‐test in A and C (****p < 0.0001) and following a 2‐way repeated measures ANOVA in B and D. **p < 0.01; Bonferroni’s multiple comparison test (A, B: EAE + drug n = 10, EAE + vehicle n = 7, IFA + drug n = 5, IFA + vehicle n = 4; C, D: EAE + drug n = 9, EAE + vehicle n = 8, IFA + drug n = 6, IFA + vehicle n = 4). ANOVA = analysis of variance; EAE = experimental autoimmune encephalomyelitis; NIM = nimodipine; SCBF = spinal cord blood flow; VEH = vehicle. [Color figure can be viewed at www.annalsofneurology.org]
