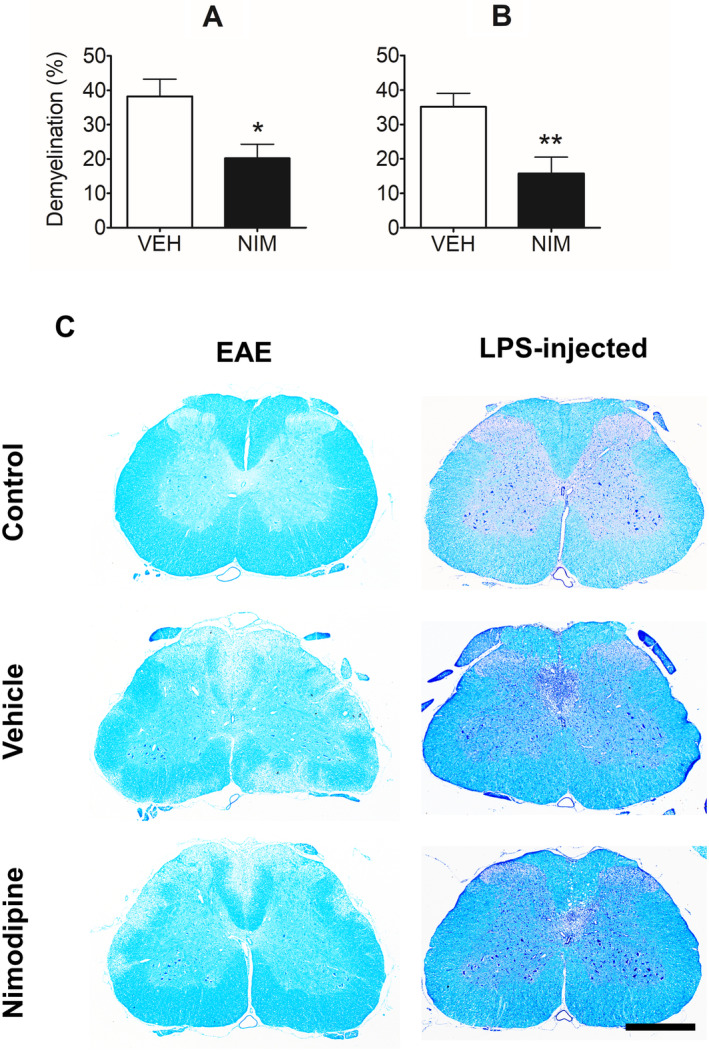
Figure 6.

The effect of nimodipine on demyelination. Grouped data with representative micrographs are presented. (A) Shows the percent demyelination across the entire spinal cord section in animals with EAE compared with controls, whereas graph (B) shows the percentage demyelination of the dorsal columns in LPS‐injected animals, following treatment with either vehicle or nimodipine. Representative sections from control (top) and EAE animals (left), or LPS‐injected animals (right), treated with vehicle (middle) or nimodipine (bottom) labeled with LFB (left) or LFB/PAS/H (right) are shown in (C) where the paucity of blue coloration in the white matter denotes demyelination. *p < 0.05, **p < 0.01; Mann–Whitney U test. Scale bars 0.5 mm. EAE = experimental autoimmune encephalomyelitis; LFB/PAS/H = Luxol fast blue, periodic acid Schiff, and hematoxylin; LPS = lipopolysaccharide; NIM = nimodipine; VEH = vehicle.
