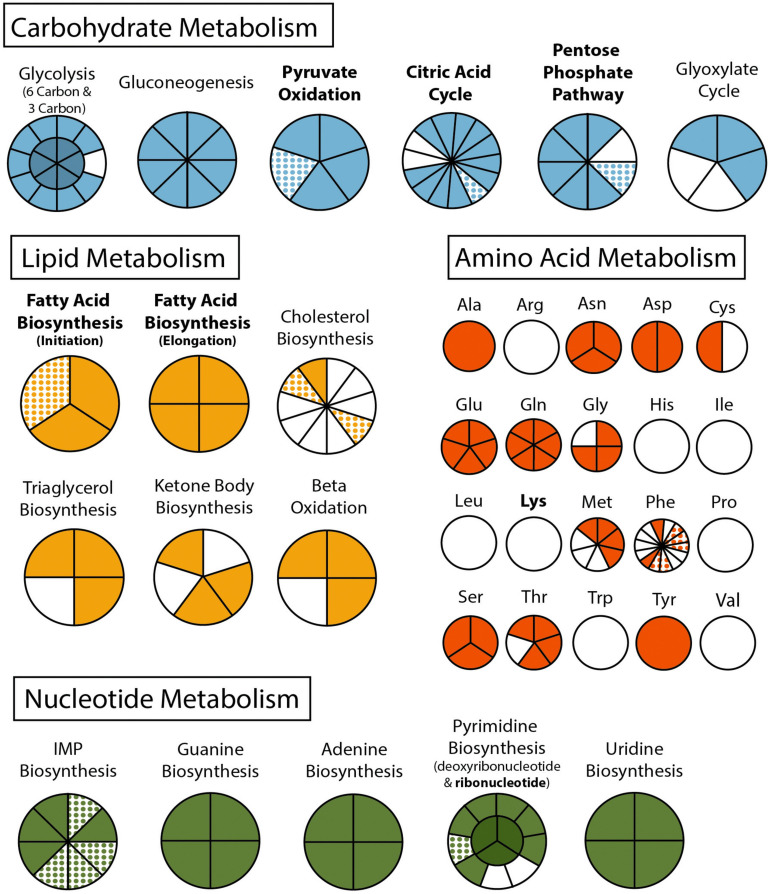
FIGURE 2.
Metabolism of Cardiosporidium cionae. Solid colors indicate genomic protein homologs, dots show where homologs were only found in the transcriptome data, and bold pathways represent bacterial endosymbiont contributions. This figure corresponds to the genome and transcriptome information in Supplementary Table 2.

