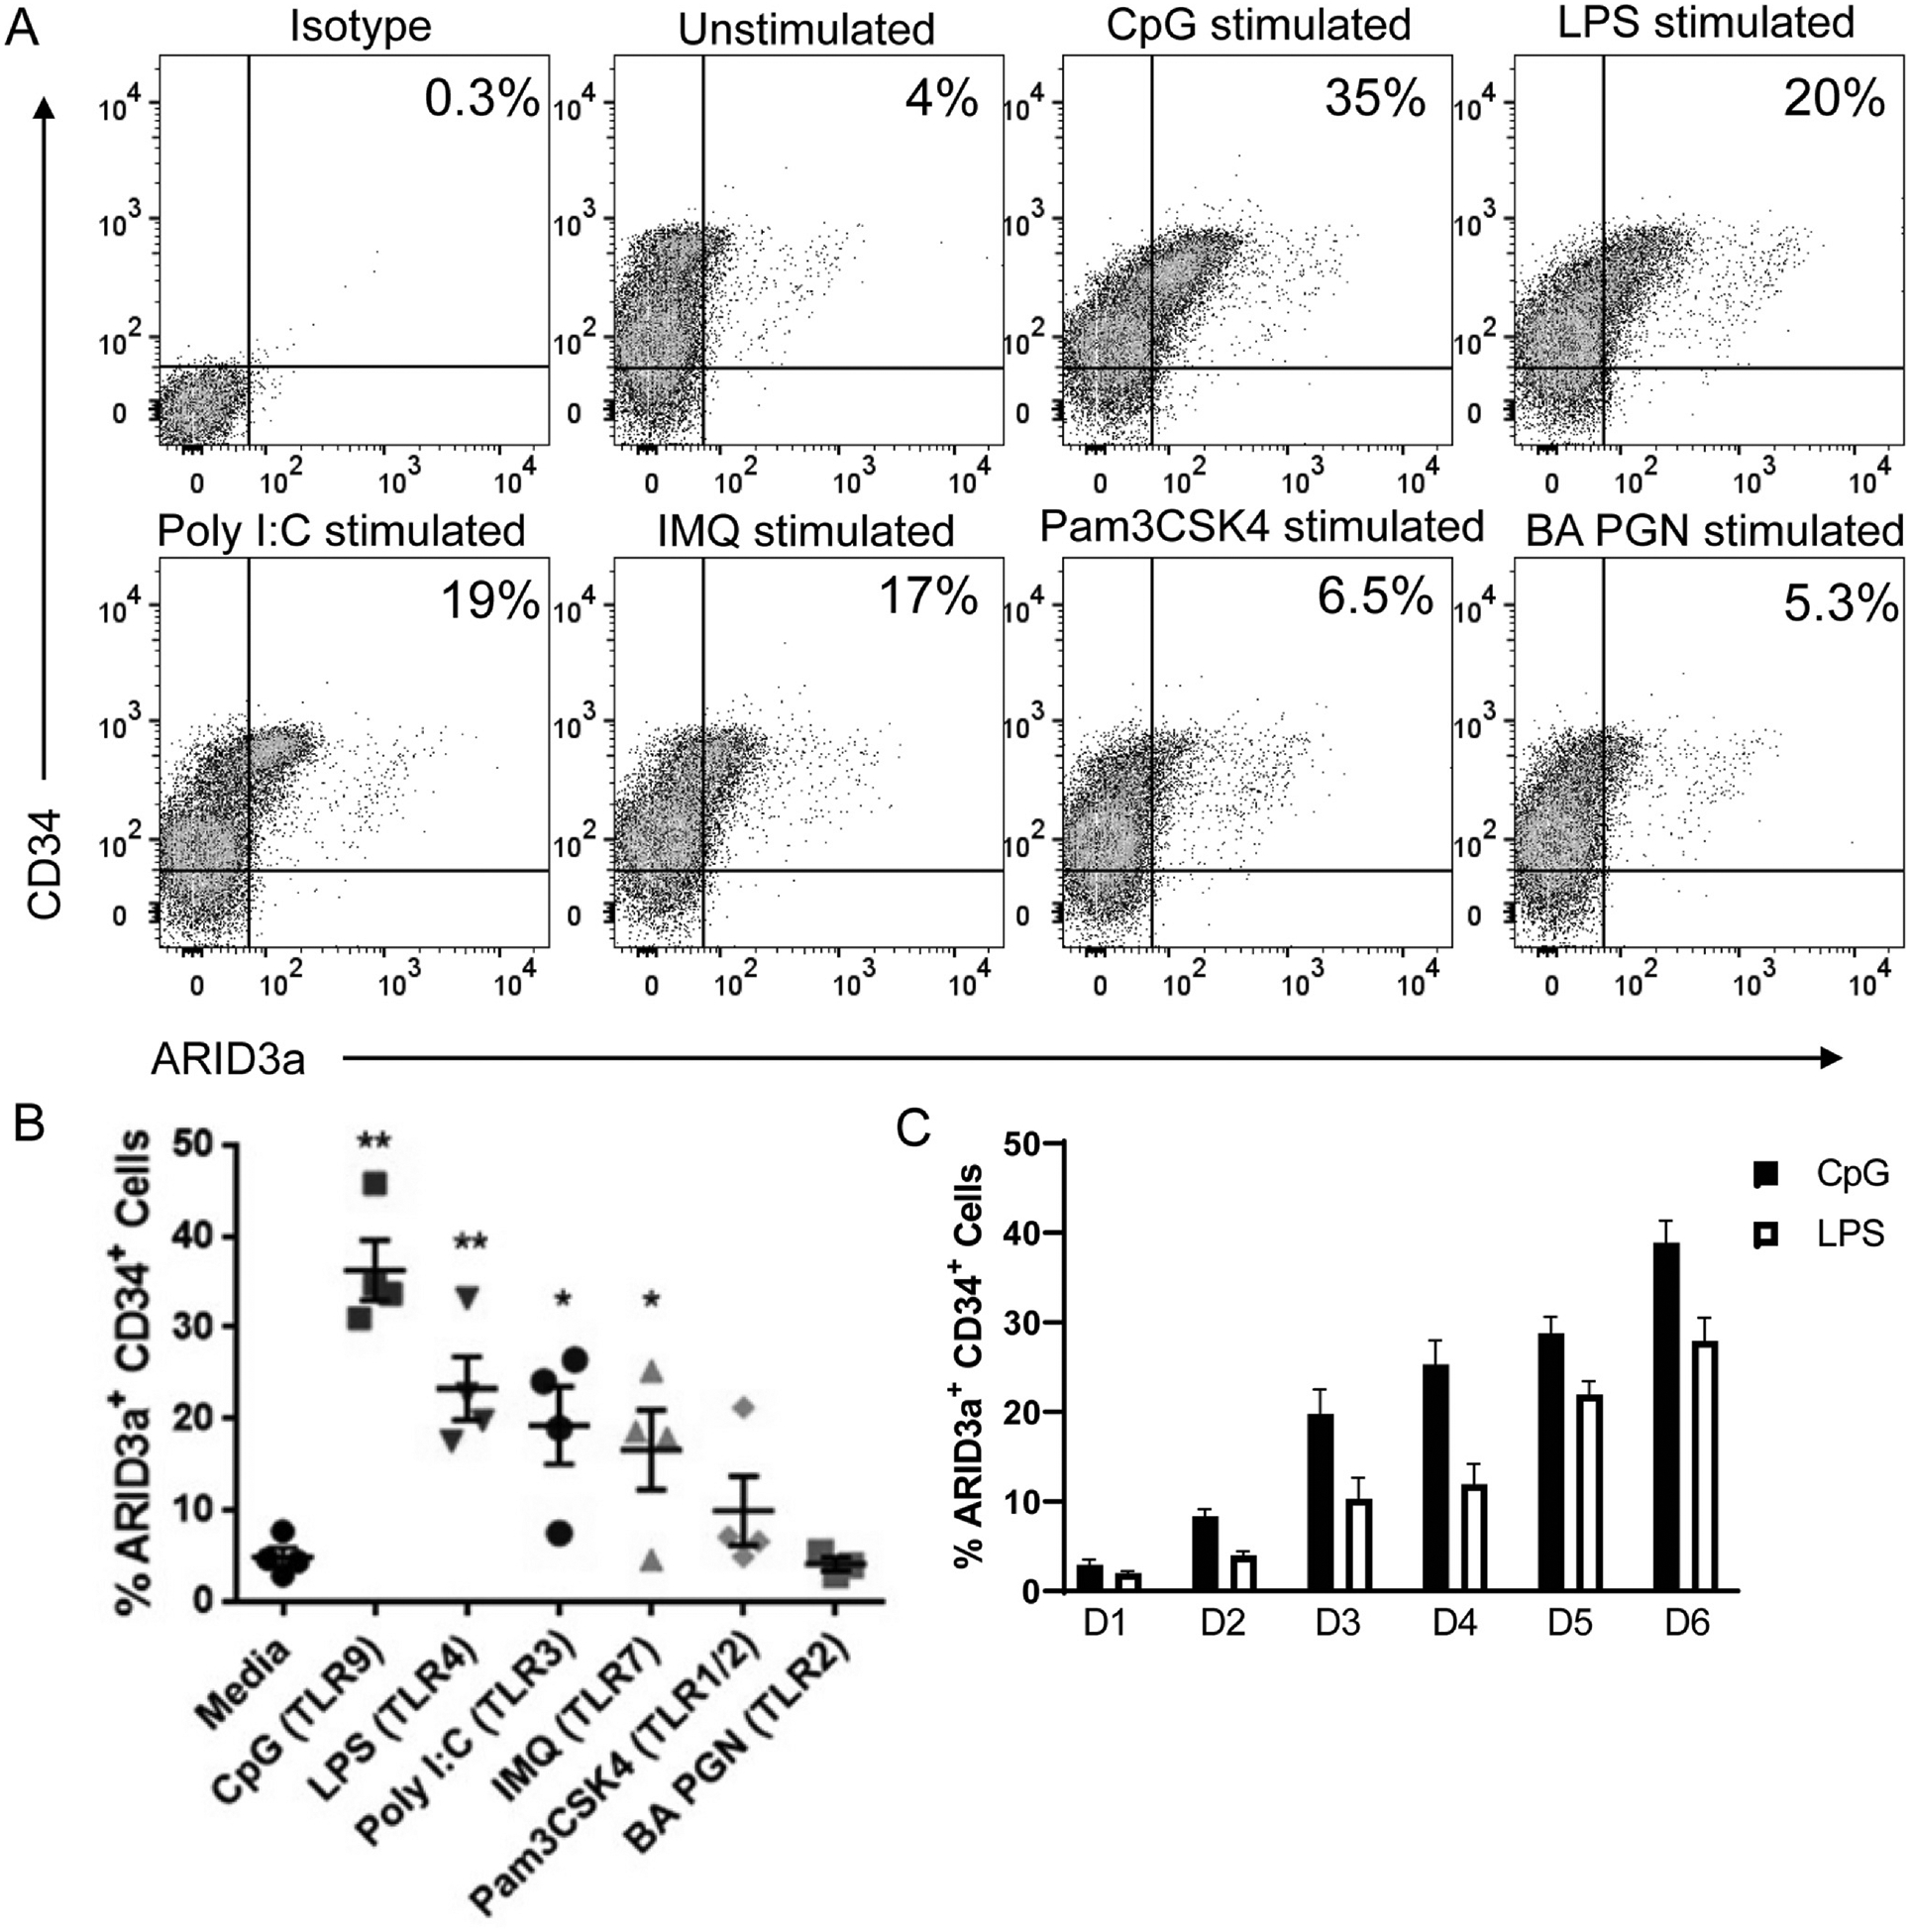
Fig. 1.

TLR ligands induce ARID3a expression in HSPCs. (A) HSPCs were stimulated with various TLR ligands for 6 days and analyzed by flow cytometry for ARID3a and CD34 expression. Representative plots are shown with ARID3a frequencies. (B) Cumulative data from 4 experiments are indicated. Each point represents averages of technical triplicates from a different individual. (C) Daily increases in ARID3a expression frequencies are shown after CpG or LPS stimulation over the six days, D1-D6, from 4 independent experiments. Averages, standard error bars and significance, assessed by paired t test, * p < 0.05; ** p < 0.01 are shown.
