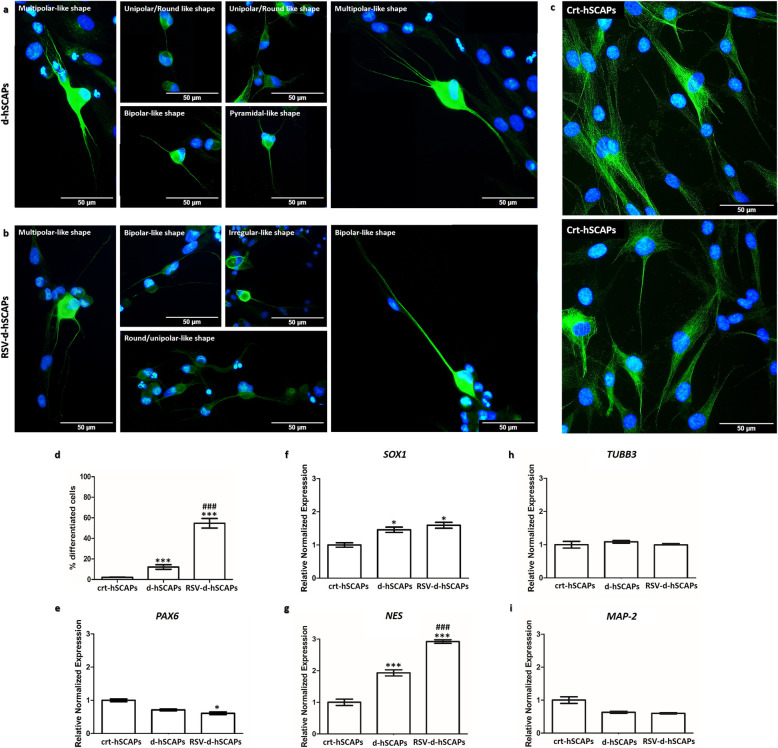
Fig. 4.
Neuronal induction. a–c The immunofluorescences profiling (β-III tubulin) of crt-hSCAPs, d-hSCAPs, and RSV-d-hSCAPs. These visualizations have revealed that a neuronal induction medium successfully promotes morphological change of d-hSCAPs and RSV-d-hSCAPs into neuronal-like cells, while the crt-hSCAPs still clearly exhibit as fibroblast-like cells. d The percentage of neuronal differentiation between d-hSCAPs and RSV-d-hSCAPs. Resveratrol pre-treatment efficiently enhances the percentage of differentiated cells from 12.11 ± 5.08 up to 54.71 ± 10.39. Data were expressed as the mean ± SEM; n = 5, ***p < 0.001 compared to crt-hSCAPs, ###p < 0.001 compared to d-hSCAPs. e–i The genes expression profiling (PAX6, SOX1, NES, TUBB3, and MAP-2) of crt-hSCAPs, d-hSCAPs, and RSV-d-hSCAPs. Resveratrol pre-treatment synergistically promotes the neural progenitor marker gene; the decreasing expression was expressed in PAX6. The increased expression was highly expressed in SOX1 and NES, but not inTUBB3 or MAP-2. Data were expressed as the mean ± SEM; n = 3, *p < 0.05, ***p < 0.001 compared to crt-hSCAPs, ###p < 0.001 compared to d-hSCAPs. Scale bars: a, b, and c = 100 μm

