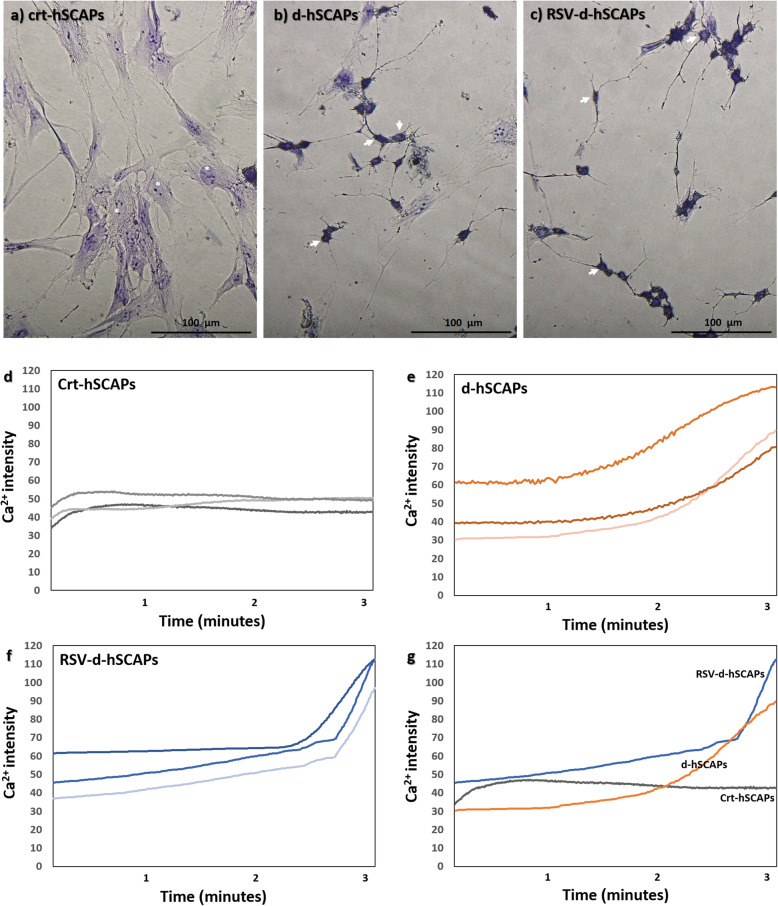
Fig. 5.
Characterization of neuronal cells. a–c Characterization of the neuronal cells with Cresyl violet staining. The differentiated cells from hSCAPs and RSV-hSCAPs revealed intense purple substance at cell body (white arrow), while the crt-hSCAPs showed the pale purple background of the nucleus (white asterisk) and dark violet of the nucleolus. Scale bars: a, b, and c = 100 μm. d–f The intracellular calcium oscillation of crt-hSCAPs, d-hSCAPs, and RSV-d-hSCAPs. The intensity of calcium has showed to be slightly increased and suddenly reached the highest peak in both d-hSCAPs and RSV-d-hSCAPs, while the hSCAPs exhibited steady patterns as a baseline intensity (n = 3). g The graph plotted between Ca2+ intensity and time (minutes) of crt-hSCAPs (gray line), d-hSCAPs (orange line), and RSV-d-hSCAPs (blue line)

