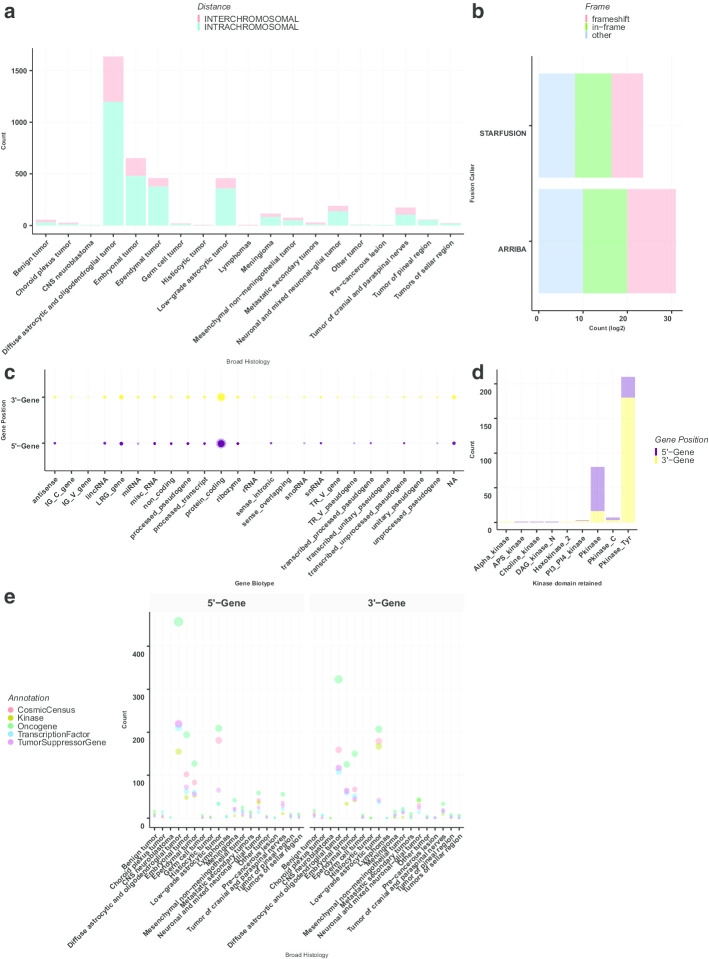
Fig. 2.
Fusion annotations generated by annoFuse a Distribution of intra- and inter-chromosomal fusions across histologies. b Transcript frame distribution of fusions detected by Arriba and STAR-Fusion algorithms. c Bubble plot of gene partner distribution with respect to ENSEMBL biotype annotation (Size of circle proportional to number of genes). d Barplots representing the distribution of kinase groups represented in the PBTA cohort annotated by gene partner. (Alpha_kinase = Alpha-kinase family, Hexokinase_2 = Hexokinase, PI3_PI4_kinase = Phosphatidylinositol 3- and 4-kinase, Pkinase = Protein kinase domain, Pkinase_C = Protein kinase C terminal domain, Pkinase_Tyr = Protein tyrosine kinase). e Bubble plot representing the distribution of fused genes as oncogenes, tumor suppressor genes, kinases, COSMIC, predicted and curated transcription factors (Size of circle proportional to number of genes). Genes belonging to more than one category are represented in each. In all panels except for B, fusion calls were merged from both STAR-Fusion and Arriba

