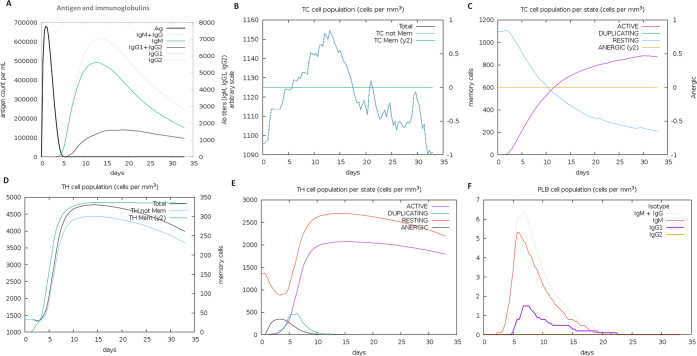
Figure 8.
Designed vaccine immune response: (A) elevation of immunoglobulins at different concentrations of antigen, (B) cytotoxic T-cell count, (C) T-cytotoxic cell populations at different states; resting and active state (D) helper T-cell population, (E) helper T-cell count at resting and active state, and (F) B-cell population (IgM, IgG1, and IgG2) in response to the designed vaccine.

