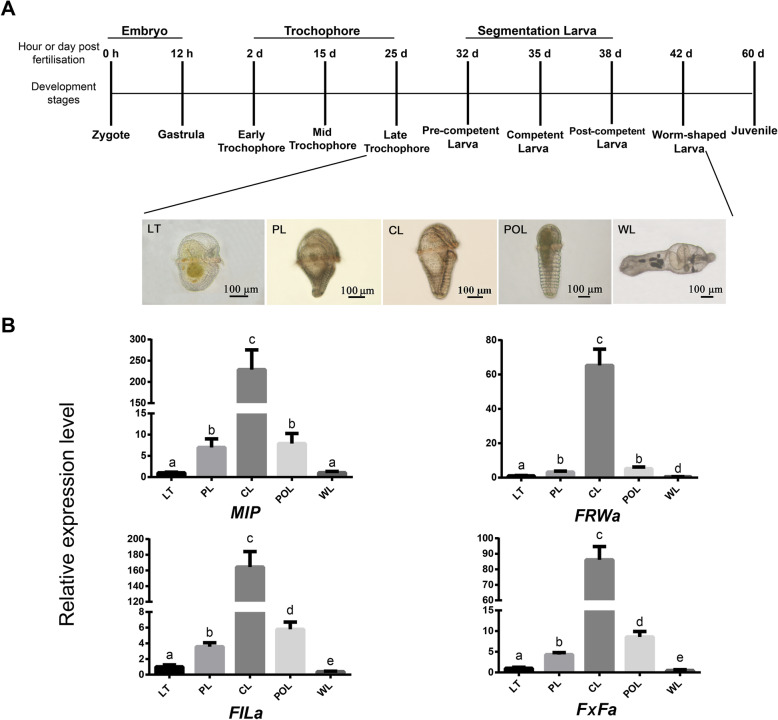
Fig. 4.
The relative expression levels of the pNP genes in U. unicinctus larvae during the settlement. a, A time course of U. unicinctus development indicating qRT-PCR sampling strategy employed in this study. b, the relative expression levels of the pNP genes. LT, late-trochophore (25 dpf, pelagic larva); PL, pre-competent larva (32 dpf, correspond to ES in transcriptome data); CL, competent larva (35 dpf, correspond to SL in transcriptome data); POL, post-competent larva (38 dpf); WL, worm-shaped larva (42 dpf, benthic larva). Data are indicated as mean ± SD from triplicate experiments and analyzed using One-way ANOVA followed by Tukey’s HSD test. Different letters indicate significant difference between different developmental stages (p < 0.05)

