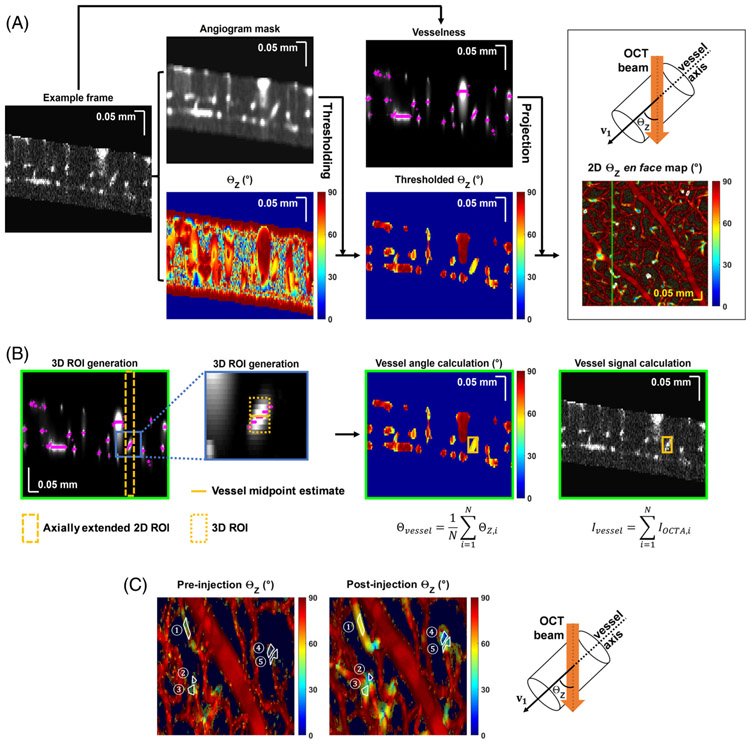
FIGURE 1.
Data processing. (A) 2D ΘZ en face map generation. An example frame from the inner retina angiogram volume is shown, after background correction and elimination of non-inner retinal tissue. The volume is blurred to generate the angiogram mask volume, eigen-decomposed to generate vessel orientation relative to the incident OCT beam, ΘZ, and Frangi filtered to generate the vesselness volume. Vessel angle ΘZ (top right) is defined as the angle between OCT incident beam (Z axis) and vessel axis (eigenvector). The ΘZ volume is thresholded by the angiogram mask volume to remove static tissue. ΘZ values at maximum vesselness locations (magenta crosses) are projected to create the 2D en face (X and Y) ΘZ map. A 2D ROI (white polygon), selected from the en face ΘZ map (A), is then converted to a 3D ROI. (B) Starting from the vesselness frames, the axial positions (magenta crosses) of the maximum vesselness values within the 2D ROI are averaged to estimate the vessel midpoint (gold line). Then, a 7 pixel range (+/− 3 pixels, ~25.8 μm, gold box) centered on this midpoint, is used as the depth (Z) range for the final 3D ROI (the original 2D ROI delimits the 3D ROI in X and Y). Within this 3D ROI, thresholded ΘZ and angiogram values for each voxel (indexed by i) are averaged and summed, respectively, to yield the vessel orientation (Θvessel) and vessel signal (Ivessel). (C) Zoom showing corresponding 2D ROIs on pre- and post-injection en face ΘZ maps

