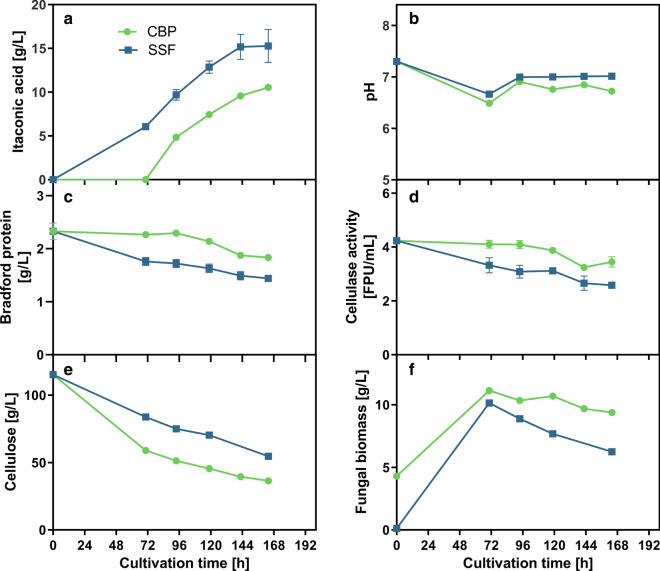
Fig. 4.
Comparison of CBP and SSF of cellulose to itaconic acid using U. maydis and T. reesei. a Shows the itaconic acid production of U. maydis Δcyp3 ΔPria1::Petef Δfuz7 Petef mttA from 120 g/L α-cellulose either using undiluted sterile-filtered T. reesei supernatant (SSF) or full culture broth (CBP) of a 1 week old pre-culture of T. reesei RUT-C30 (RFP1). b Shows the pH during cultivation. c Shows the protein concentration measured in the supernatant, which should correspond mainly to extracellular cellulases. d Shows the corresponding cellulase activity as measured by the filter paper assay. e Shows the residual cellulose concentration during the cultivation as determined by the Updegraff assay and f the corresponding dry weight of fungal biomass estimated from the weight loss during Updegraff assay. T. reesei RUT-C30 (RFP1) culture was grown for 1 week for cellulase production and then sterile filtered or directly used for the CBP experiment. The filtrate and the full culture broth were subsequently supplemented with 120 g/L α-cellulose, 0.32 g/L KH2PO4, 33 g/L CaCO3 and finally inoculated to a final OD600 of 0.67 using a pre-culture of U. maydis Δcyp3 ΔPria1::Petef Δfuz7 PetefmttA. The culture was performed with 25 mL filling volume in 250 mL Erlenmeyer flasks at 200 rpm, 50 mm shaking diameter and 30 °C. Values shown for itaconic acid and pH are means of biological triplicates, error bars show standard deviation. For cellulase activity, bradford protein, residual cellulose and fungal biomass, samples from the triplicates were pooled in order to collect sufficient sample volume and to make accurate gravimetric measurements and therefore only single values could be measured. For c error bars show standard deviation of technical triplicates, for d deviation of the mean from technical duplicates. Collected data are only shown until 164 h of cultivation. Beyond 164 h of cultivation, accurate and representative sampling was not possible anymore due to the high viscosity and inhomogeneity of the cultivation broth. The full dataset can be found in the Additional file 2: “Numerical data”

