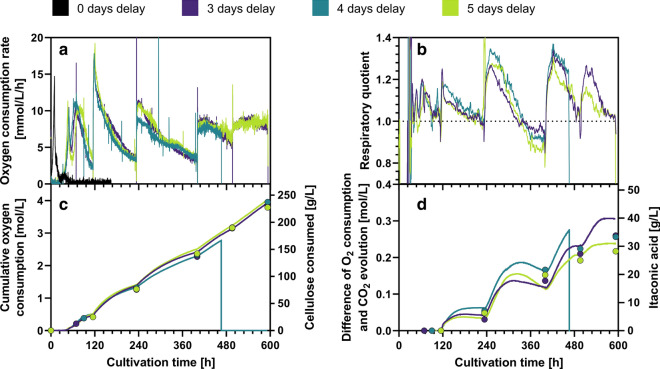
Fig. 7.
Respiration-based online process monitoring during co-culture CBP. a Shows the oxygen consumption rate. The first peak indicates the consumption of 5 g/L glucose, the second peak marks the consumption of the initial cellulose. The following peaks were caused by the cellulose feeding; a sharp increase in oxygen consumption was observed after every cellulose feeding interval. b Shows the corresponding respiratory quotient as a rolling average of the original data for clarity and noise reduction. c shows the cumulative oxygen consumption as an indicator for cellulose consumption. The closed circles show the actual cellulose consumption as determined from offline measurements. d Shows the difference between cumulative oxygen consumption and cumulative CO2 evolution as an indicator for itaconic acid formation. Closed circles indicate corresponding itaconic acid concentrations as determined from offline measurements. Y-axis were scaled in a way that 1 mmol CO2 evolution equals 1 mmol itaconic acid produced. Because of a software bug, the 4 days delay experiment stopped recording after 468 h. For comparison, values from a pure culture reference experiment of U. maydis grown in a glucose fed-batch can be found in Additional file 1: Figure S4

