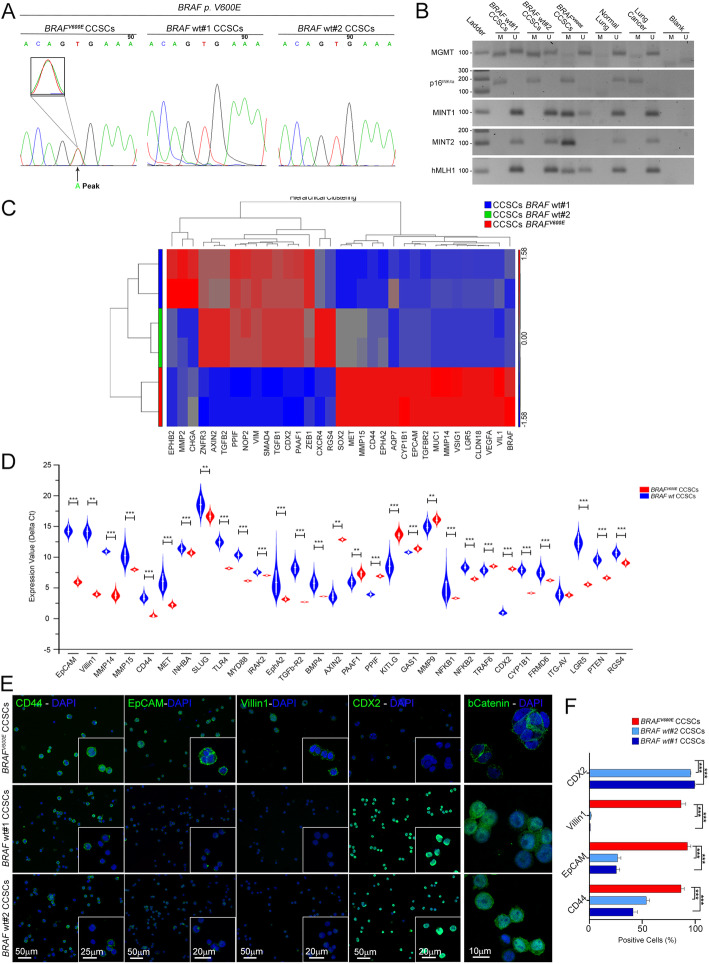
Fig. 1.
Phenotypic fingerprint of BRAFV600E and BRAF wt CCSCs. a Automatic sequencing electrogram showing a minor “A” peak at T1796 denoting a CCSCs’ population retaining such a “T1796A” mutation with a T to A mutation in codon 599 (BRAFV600E CCSCs; arrowhead). b MGMT, p16INK4a, MINT1, MINT2 and hMLH1 methylation was evaluated in BRAFV600E and BRAF wt CCSCs by using primers for methylated (M) and unmethylated (U) alleles of bisulfite-treated DNA. Normal and cancer lung tissues as positive controls. c Heat map of one-way hierarchical clustering of 33 differentially expressed genes in BRAF-mutated vs. BRAF wt CCSCs revealing a typical CRC serrated signature for the former as compared to the latter. A dual-color code represents genes up- (red) and down-regulated (blue), respectively. d Differentially enriched genes associated with cellular migration and invasiveness, matrix degradation and epithelial phenotype in BRAFV600E vs BRAF wt CCSCs, as confirmed by qPCR. ***P < 0.001, **P < 0.01, Mann-Whitney test. e By means of confocal imaging, widespread positivity for CD44, EpCAM and Villin1 markers and weak signal for CDX2 in BRAFV600E CCSCs was shown. Positive nuclear b-catenin staining was retrieved exclusively in BRAF wt CCSCs. Insets: higher magnifications. Scale bars, 50um, 25um, 20um and 10um. Quantification of each marker is shown in f. ***P < 0.001, one-way ANOVA Tukey’s multiple comparison test. Data are mean ± SEM

