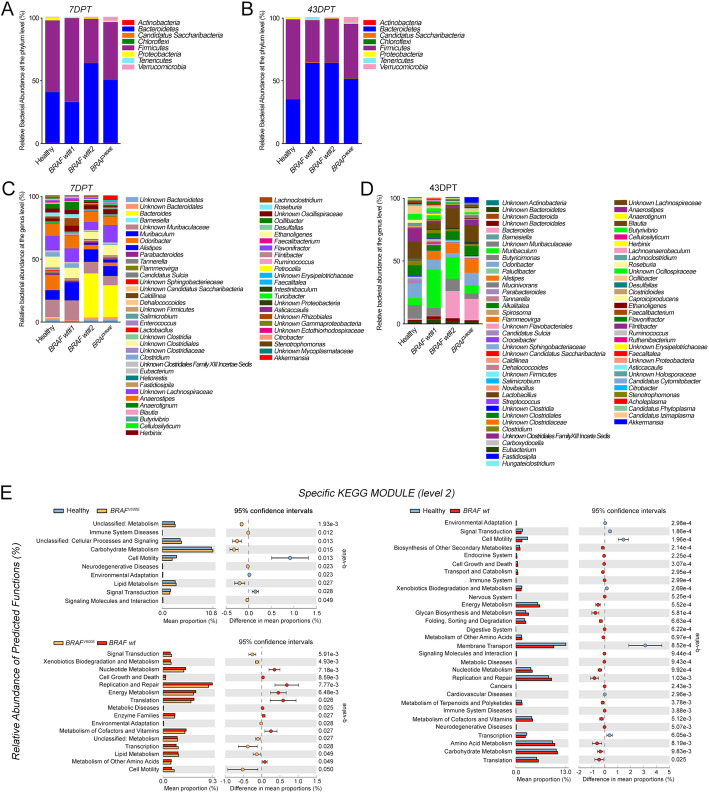
Fig. 4.
BRAFV600E CRC exhibits specific bacterial markers and a typical functional microbiota composition. Gut microbiota relative abundance (% similarity) at the phylum (a-b) and genus level (c-d) in gut microbiota of mice carrying BRAFV600E and BRAF wt CRC and controls at 7 DPT (a-c) and 43 DPT (b-d). e Significative relative abundance of predicted function (mean proportions %) and different abundance of predicted function (difference in mean proportion %) for specific KEGG modules level 2 in pairwise comparisons between controls, BRAFV600E (left; top) and BRAF wt CRCs (right) or between the two CRC groups (left; bottom). FDR-adjusted p value (q value) from Mann-Whitney test are shown

