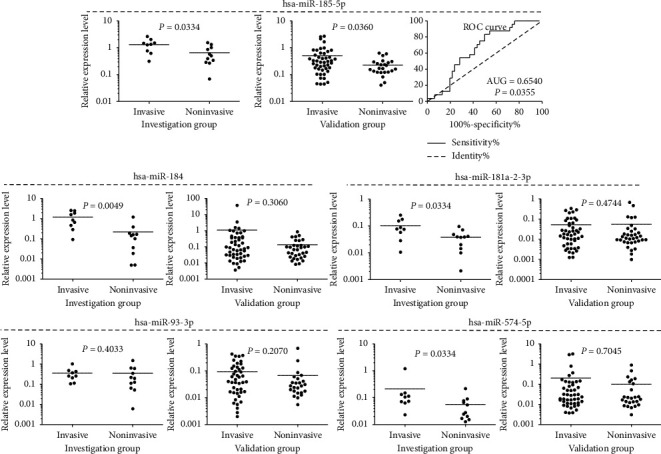
Figure 2.

Comparison of invasive and noninvasive gonadotropic PitNETs in terms of expression level of selected miRNAs measured with qRT-PCR assay. Analyses of discovery and validation groups are presented in separate graphs. Mean values are horizontal lines.
