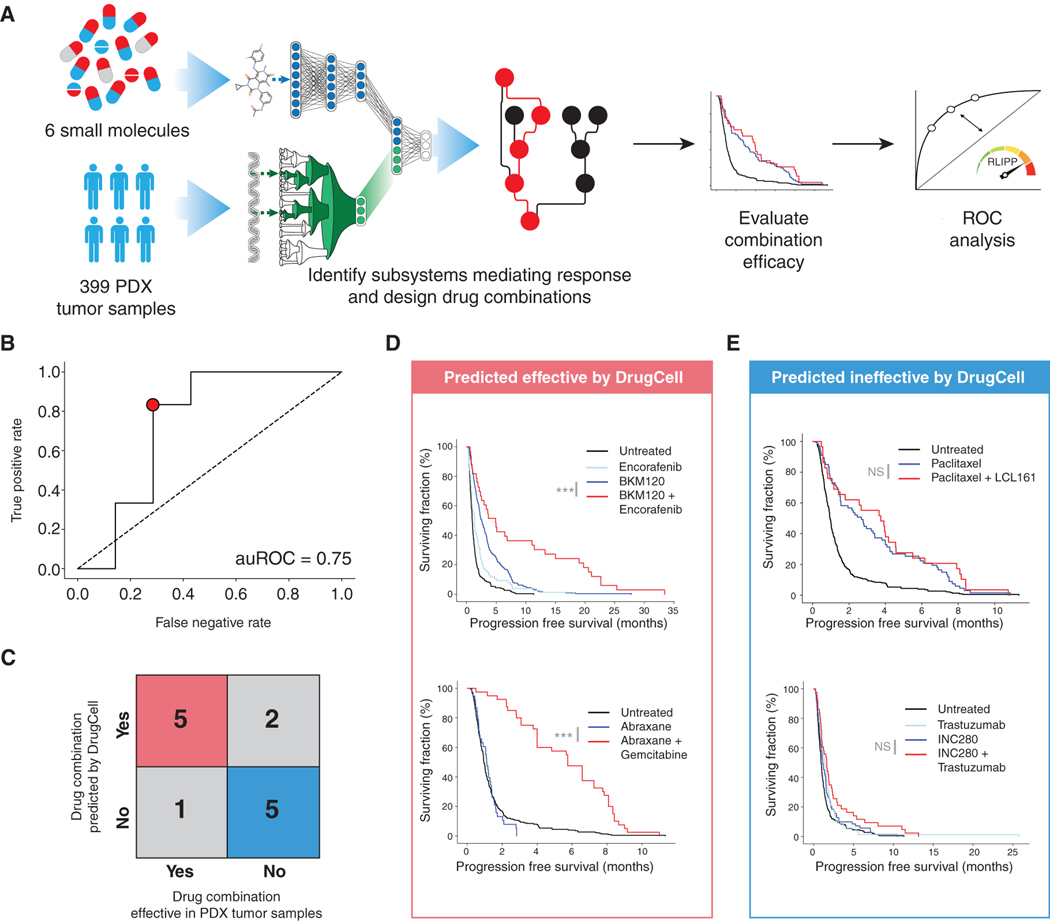
Figure 6. Guiding Combination Therapy in Patient-Derived Xenograft Tumors.
(A) Flowchart of analysis procedure.
(B) ROC curve of DrugCell performance in distinguishing effective from ineffective drug combinations.
(C) Error matrix for point indicated in (B) demonstrating best performance of DrugCell against the PDX dataset.
(D) Survival curves for drug combinations predicted to be effective by DrugCell (true positives) showing a significant improvement in progression-free survival.
(E) Survival curves for drug combinations predicted to be ineffective by DrugCell (true negatives) showing a lack of improvement in progression-free survival. p values indicate significance by log rank test. ***p <0.0001, NS indicates not significant.

