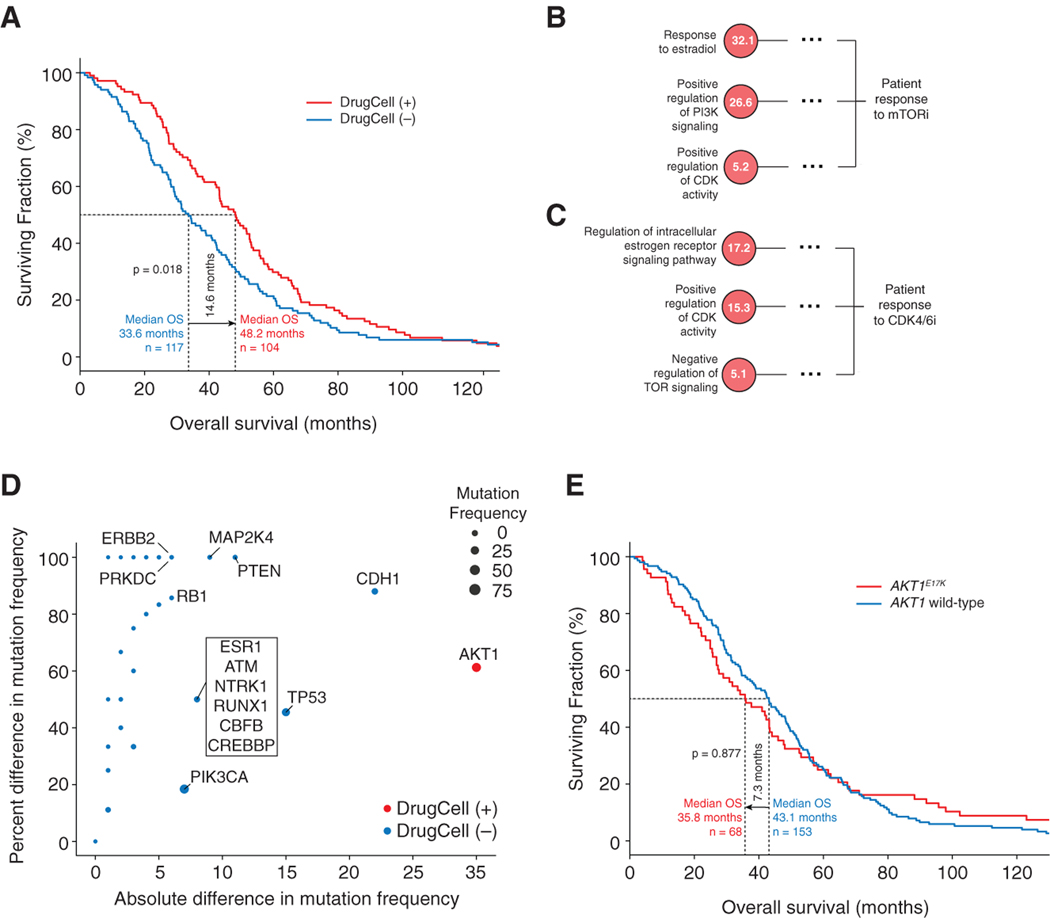
Figure 7. Guiding CDK4/6 and mTOR Inhibitor Therapy in ER-Positive Breast Cancer Patients.
(A–C) (A) Survival curves for DrugCell (+) and DrugCell (−) patients treated with CDK4/6 or mTOR inhibitors in any line of therapy. The p value indicates significance by log rank test. (B, C) Important subsystems used by DrugCell to simulate (B) mTOR or (C) CDK4/6 inhibitor sensitivity. Dotted line abbreviates parent subsystems at subsequent layers of the hierarchy. RLIPP scores are displayed inside each node.
(D) Scatterplot of the absolute (x axis) and percentage (y axis) difference in mutation frequencies of genes between DrugCell (+) and DrugCell (−) patients. Red points represent genes mutated more frequently in DrugCell (+) patients. Blue points represent genes mutated more frequently in Drug-Cell (−) patients. Point size is proportional to overall mutation frequency in the patient population.
(E) Survival curves for AKT1-mutant and wild-type patients treated with CDK4/6 or mTOR inhibitors in any line of therapy. The p value indicates significance by log rank test.

