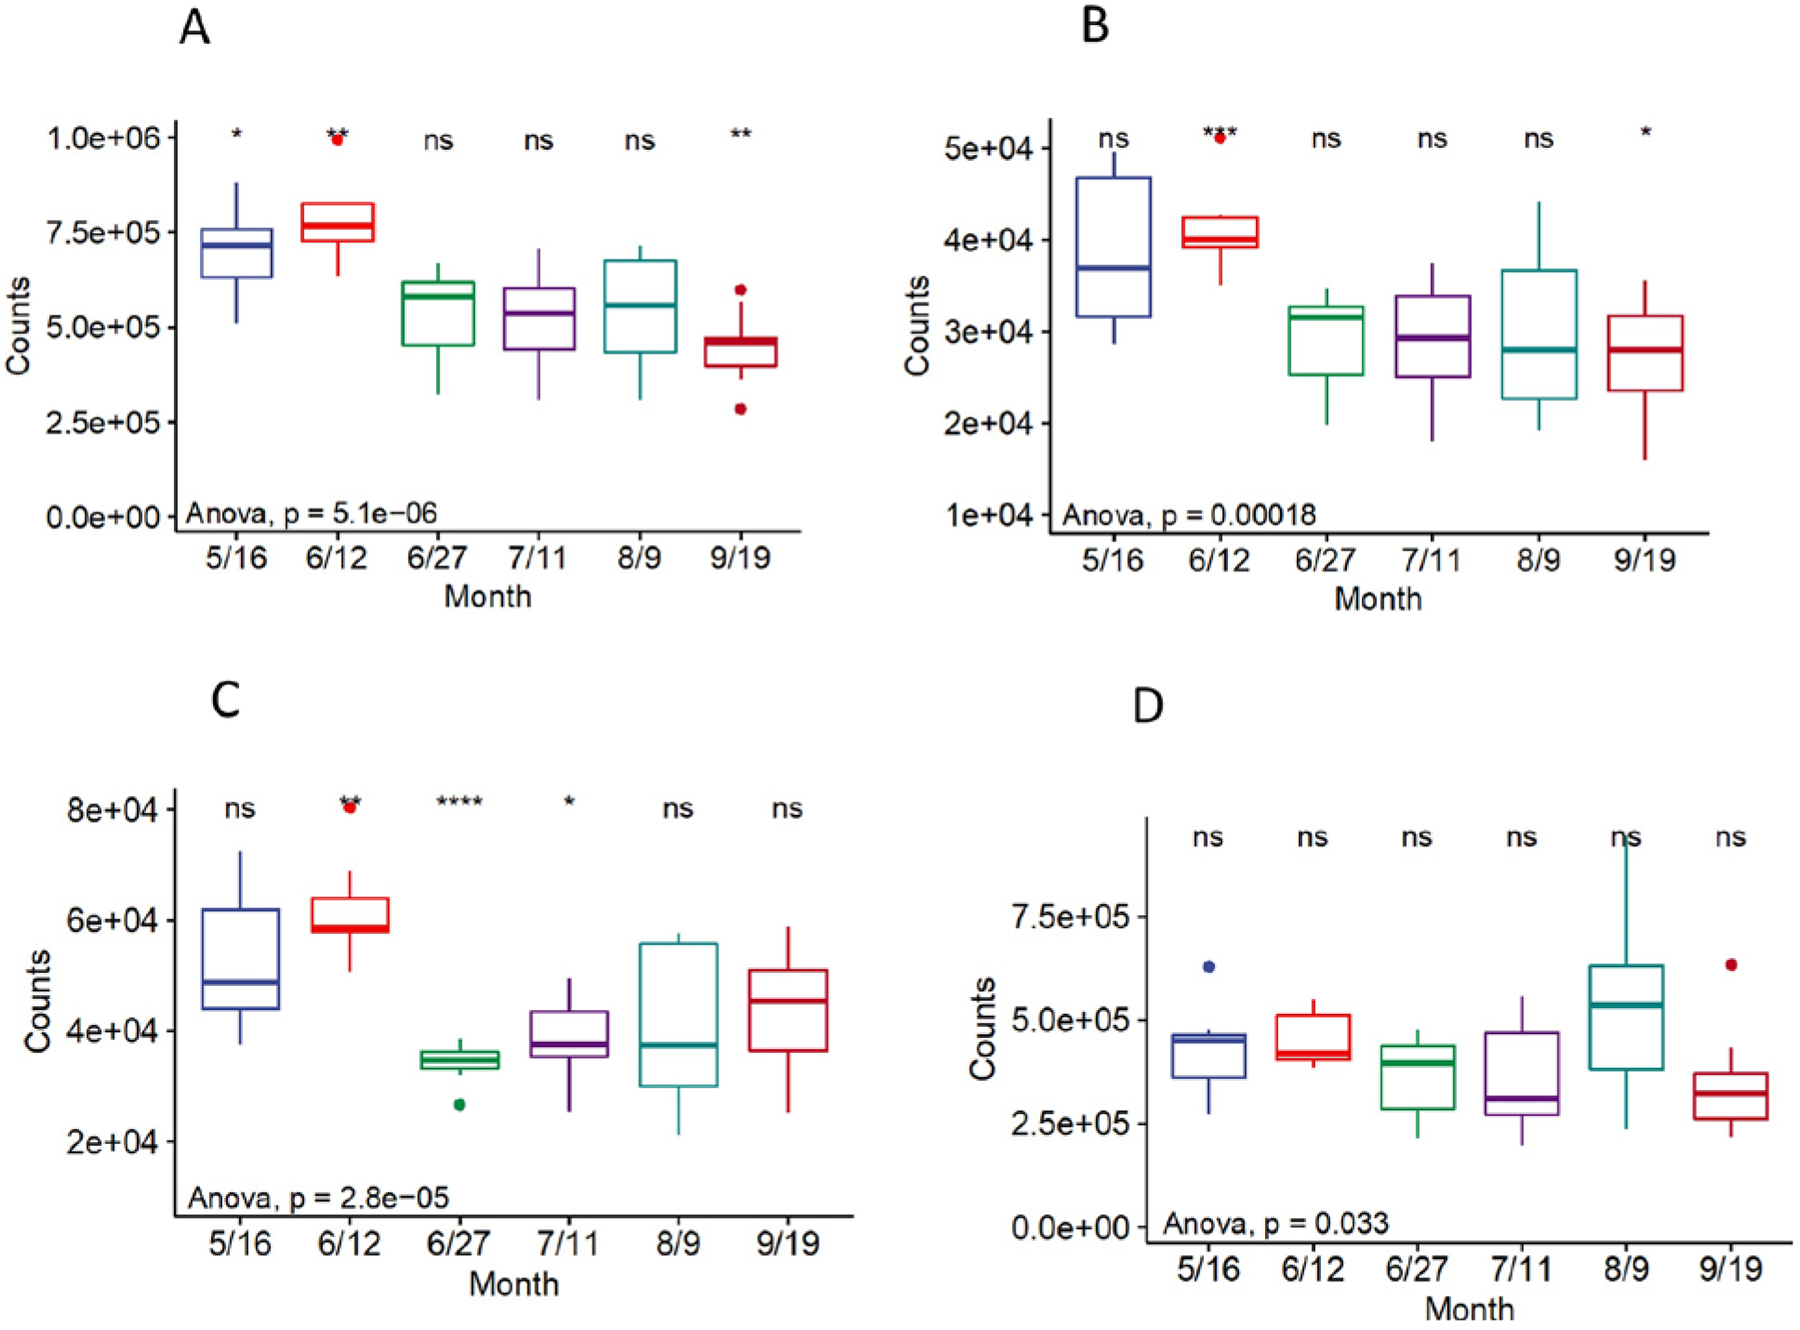
Figure 3.

Predicted metabolic pathways at a 99% sequence similarity. (A) Nitrogen Metabolism. (B, C) Carbohydrate/Phosphorus related metabolism. (D) Photosynthesis. Note the differences of y-axis scales. Reference group is “all”. The significance levels were symbolled as: ns: p > 0.05, *: p <= 0.05, **: p <= 0.01, ***: p <= 0.001 ****: p <= 0.0001.
