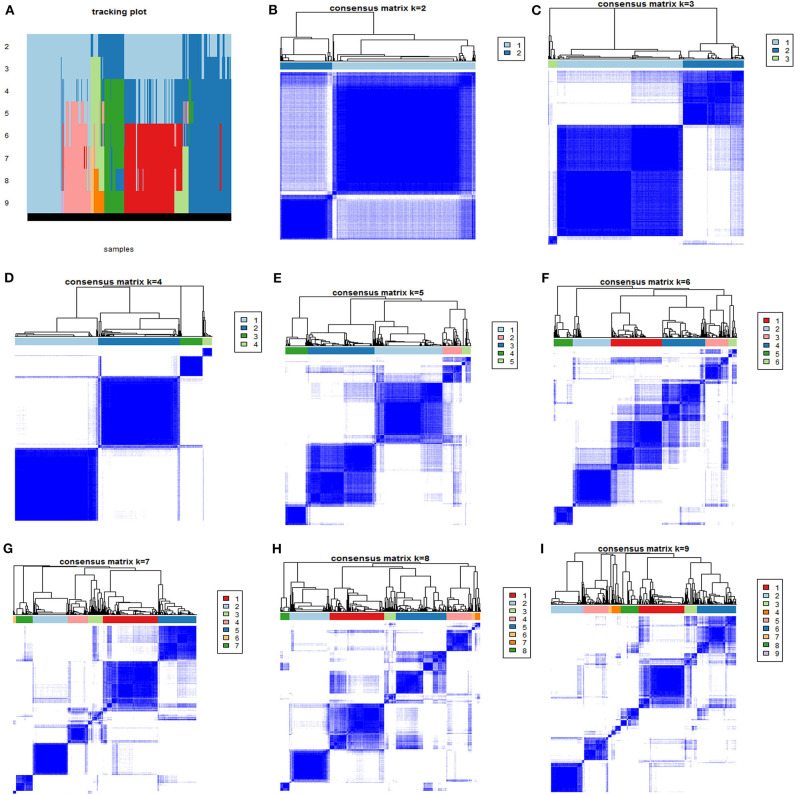
Figure 1.
The consensus matrix heatmaps of consensus k-means clustering. (A) Shows the sample distribution of 4 phenotypes after consensus k-means clustering. (B–I) Shows consensus matrix heatmaps of different subgroup numbers (k = 2, 3, 4, 5, 6, 7, 8, and 9). When k = 4, the model exhibited the clearest separation of the consensus matrix heatmap.

