
Figure 2.
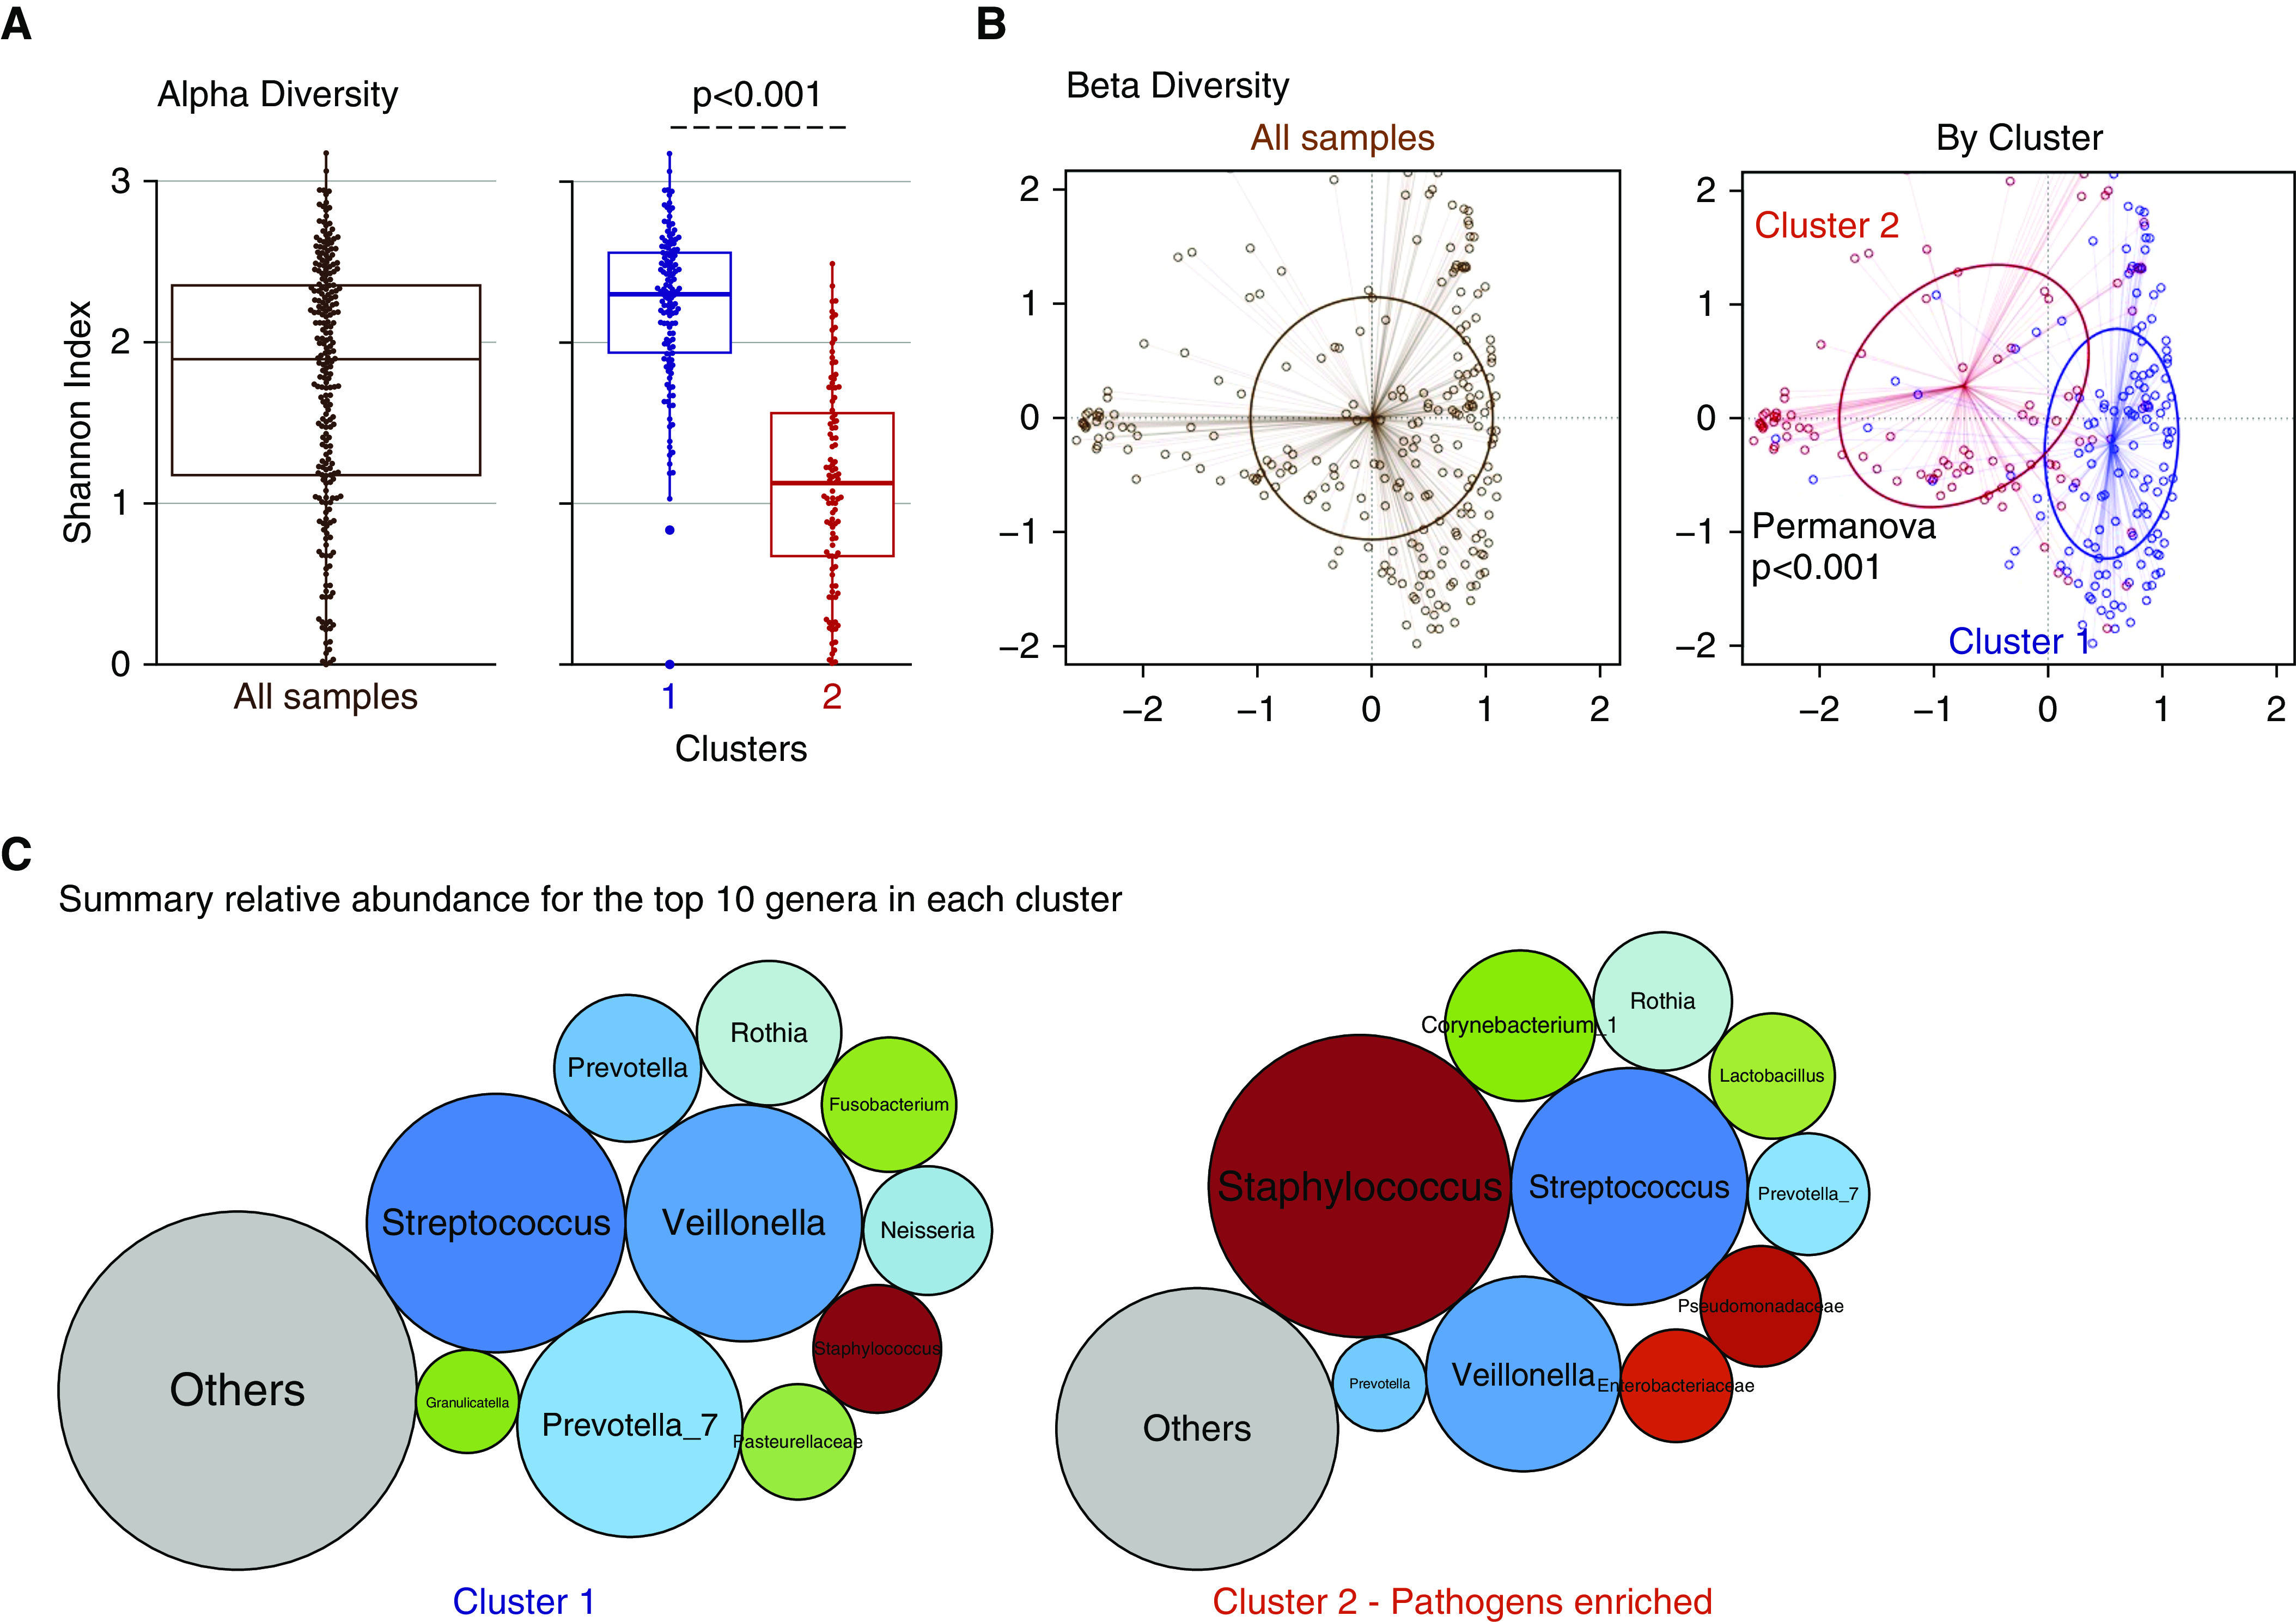
Dirichlet-multinomial-model clustering of oral-swab communities reveals a distinct cluster marked by pathogen abundance and low α diversity. (A) The α-diversity comparisons between clusters showed that cluster 2 had a significantly lower Shannon index. (B) Principal coordinates analyses for β-diversity comparisons (Manhattan distances) with Permanova for all samples included and stratified by cluster. (C) Summary of the relative abundance for the top 10 genera in each cluster, visualized as bubble plots. The diameter of each circle corresponds to relative abundance of each genus across all samples in the cluster. Streptococcus, Prevotella_7, and Veillonella were the most abundant genera in cluster 1, whereas Staphylococcus was the most abundant genus in cluster 2. Genera beyond the top 10 genera demonstrated in these bubble plots were summarized to their overall relative abundance as a single bubble in gray and annotated as “Others.” Permanova = permutational ANOVA.