
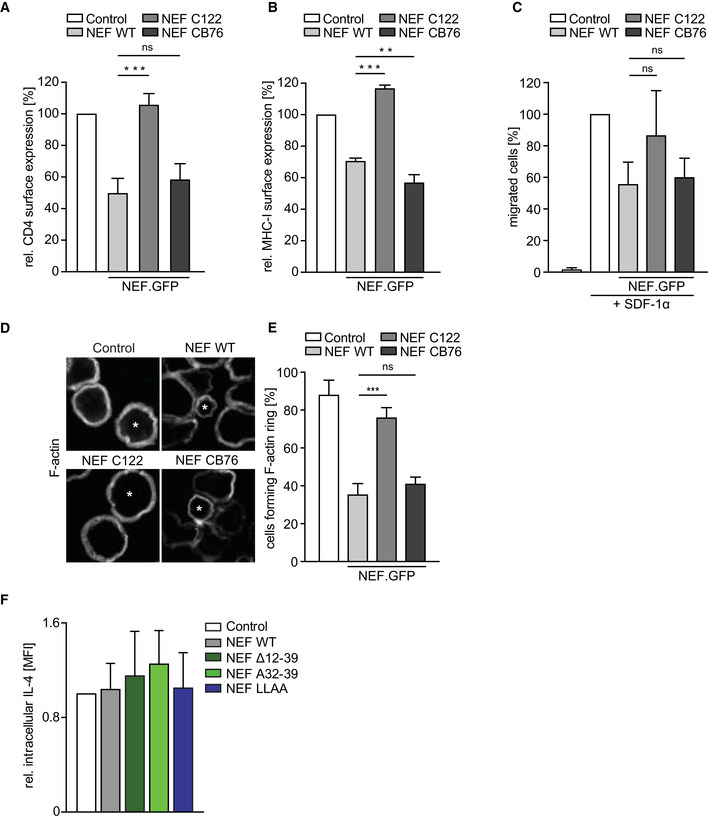
Figure EV3. Basic characterization of nef alleles and lack of effect of HIV‐1 SF2 NEF on steady state levels of IL‐4.
-
A, BFor characterization of nef alleles, standard assays were performed to evaluate the NEF protein function. One day post‐transfection of human T‐cell line (A3.01), cells were either stained with anti‐CD4 (A) or anti‐HLA‐A, B, C (B) antibody to evaluate the effect of nef alleles on receptor cell surface expression. Quantification of receptor expression was carried out as a ratio of mean fluorescence intensity (MFI) values of CD4 or MHC‐I in GFP‐expressing cells to non‐GFP‐expressing cells. The value of control was arbitrarily set to 100%, and all other values were normalized relative to that. Shown are mean values with SD of three independent experiments.
-
CChemotaxis of Jurkat (CCR7) cells toward SDF‐1α was determined by transmigration of cells in a transwell system (5 μm pore size) for 2 h after starvation in 0.5% FCS containing hunger medium. Percentage of migrated cells was calculated as ratio of % GFP‐expressing cells after migration to % GFP‐expressing cells in input. The value of control was arbitrarily set to 100%, and all other values were normalized relative to that. Shown are mean values with SD from at least three independent experiments.
-
DRepresentative confocal images of Jurkat (TAg) T cells on anti‐CD3 coated cover glasses 24 h post‐transfection, fixed, permeabilized, and stained for F‐actin. Asterisks (*) indicate cells expressing either GFP or NEF.GFP. Shown are mean values with SD from at least three independent experiments. Scale bar 10 µm.
-
EQuantification of samples as analyzed in D forming peripheral F‐actin ring upon activation by counting 50–100 GFP‐expressing cells per condition. Shown are mean values with SD from three independent experiments.
-
FIntracellular expression of IL‐4 in T cells expressing NEF or indicated mutants. Transduced T cells were treated with Golgi transport inhibitor for 4–5 h and intracellular IL‐4 was analyzed by flow cytometry. Shown are mean values with SD of the MFI of IL‐4 signal normalized to Control T cells (set to 1) in 3 independent experiments.
Data information: Statistical significance was assessed by one‐way ANOVA with Dunnett’s multiple comparisons test. ***P ≤ 0.001, **P ≤ 0.01.