
Figure 4. HIV‐1 NEF prevents GC formation upon immunization.
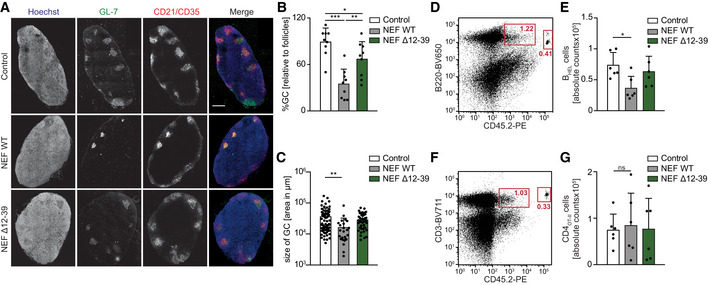
NEF impairs GC formation in immunized mice via the 12–39 region.
-
ARepresentative cross‐sections of draining LNs (dLNs) from mice 7 days post‐immunization with HEL‐OVA/CFA following adoptive transfer of BHEL and transduced CD4OT‐II cells. dLN were cryosectioned and stained with fluorophore‐conjugated antibodies against GL‐7 to reveal GCs (green), CD21/35 to stain for follicular dendritic cells (FDC, red), and Hoechst to stain for cell nuclei (blue). Scale bar, 250 µm.
-
B, CQuantification of the number of GCs relative to B‐cell follicles (B) and size of GC (C) on confocal micrographs as shown in A. Shown are mean values with SD from dLNs from three mice in two independent experiments. Each dot represents one LN (3 LNs/mouse) in B and one GC in C.
-
D–GFlow cytometry dot plots of cells in dLNs from mice 7 days post‐immunization that received the indicated transduced CD4OT‐II and BHEL cells. Adoptively transferred cells were identified and distinguished from endogenous cells of recipient SMARTA mice (CD45.1+) by staining for CD45.2. For quantification of absolute cells numbers, precision beads were used and cells double positive for B220 and CD45.2 (D, BHEL cells) or CD3 and CD45.2 (F, CD4OT‐II cells) analyzed. (E, G) Quantification of absolute BHEL cells (E) as shown in D and CD4OT‐II cells (G) as shown in F. Shown are mean values with SD of 6 mice from 3 independent experiments. Each dot represents one animal.
Data information: Statistical significance was assessed by one‐way ANOVA test with Holm–Sidak’s multiple comparison test. ***P ≤ 0.001, **P ≤ 0.01, *P ≤ 0.05.