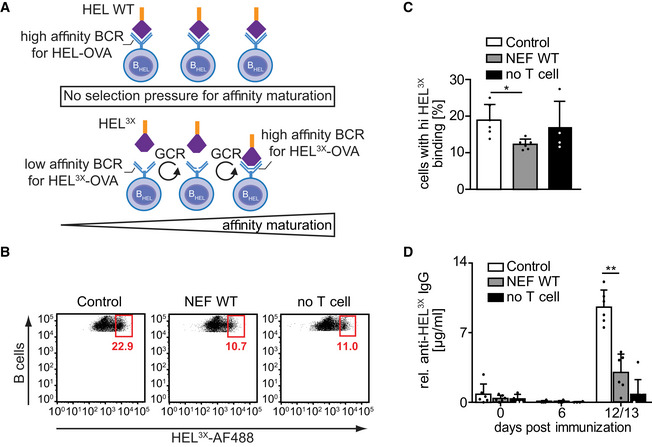
Figure EV5. NEF interferes with somatic hypermutation.

- Schematic indicating process of somatic hypermutation of BCR resulting in affinity maturation of class‐switched antibodies as occurring during germinal center reaction (GCR). Top: BHEL cells have intrinsic high affinity for HEL Ag and do not undergo additional BCR mutation. Bottom: Since HEL‐specific B cells have 10,000‐fold lower affinity for HEL3X Ag as compared to HEL, they undergo a selection process during GCR, based on their relative antigen affinity following somatic hypermutation. This process strictly depends on T‐cell help during GCR cycles.
- To analyze the effect of NEF on T‐cell help, mice were immunized with HEL3X‐OVA/CFA in the presence of Control or NEF‐expressing T cells. Cells were isolated from dLN 7 days after immunization. Single‐cell suspensions were stained with fluorophore‐conjugated anti‐B220 antibody and HEL3X protein. The proportion of B cells with high‐affinity BCR for HEL3X was assessed by the ability of in vivo proliferated and selected BHEL cells to bind to the AlexaFluor 488‐coupled HEL3X by flow cytometry. Shown are representative flow cytometry dot plots gated on B220 (B cell) and CD45.2 (donor population) double positive cells. To estimate how many B cells underwent somatic hypermutation without any T‐cell help, immunization was carried out in the absence of CD4OT‐II cells (no T cell). The gated population indicates the percentage of B cells bearing BCRs with high affinity for HEL3X.
- Quantification of BHEL cells with high affinity for HEL3X as shown in B. Shown are mean values with SD from 4 to 6 mice from two independent experiments. Each dot represents one animal.
- Production of anti‐HEL3X IgG at the indicated days post‐immunization with HEL3X‐OVA/CFA, following adoptive transfer of BHEL cells and Control or NEF‐expressing CD4OT‐II cells. Shown are mean values with SD from 4 to 10 mice analyzed from 2 independent experiments. Each dot represents one animal.
Data information: P‐values in C and D were calculated by a Kruskal–Wallis with Dunn’s multiple comparison test. **P ≤ 0.01, *P ≤ 0.05.
