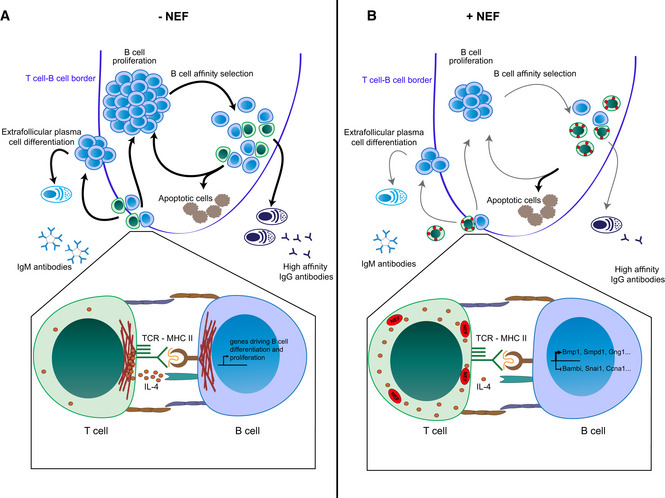
Figure 7. Schematic model of the disruption of T‐cell help by HIV‐1 NEF.

Overview of the effects of HIV‐1 NEF at the level of the GC (upper panels) and the T‐B IS (lower panels).
- Undisturbed physiological reactions in the absence of Nef.
- Effects in the context of HIV‐1 infection due to expression of NEF. See text for details.
