
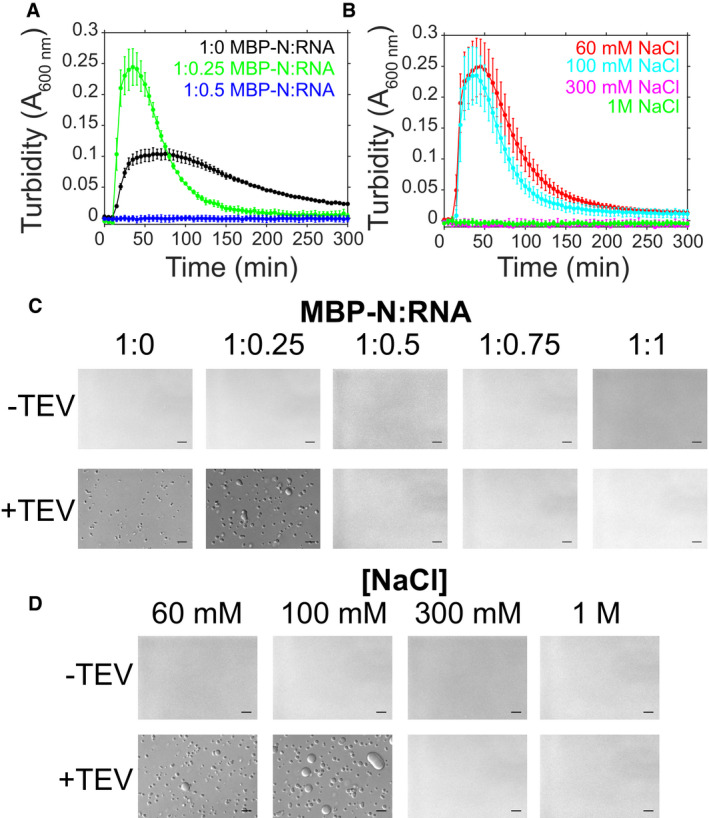
Figure 4. SARS‐CoV‐2 N LLPS is modulated by salt and RNA.
-
A–DPhase separation over time as monitored by turbidity of 50 μM MBP‐N in 50 mM Tris pH 7.4 after addition of TEV protease (A) with varying torula yeast RNA (at 100 mM NaCl) or (B) varying NaCl concentrations (at constant RNA concentration). Error bars represent standard deviation of three replicates. DIC micrographs of 50 μM MBP‐N in 50 mM Tris pH 7.4 (C) with varying torula yeast RNA concentrations (at 100 mM sodium chloride) and (D) varying sodium chloride concentrations (at constant RNA concentration), with or without TEV protease (to cleave MBP from N). Scale bars represent 50 μm.