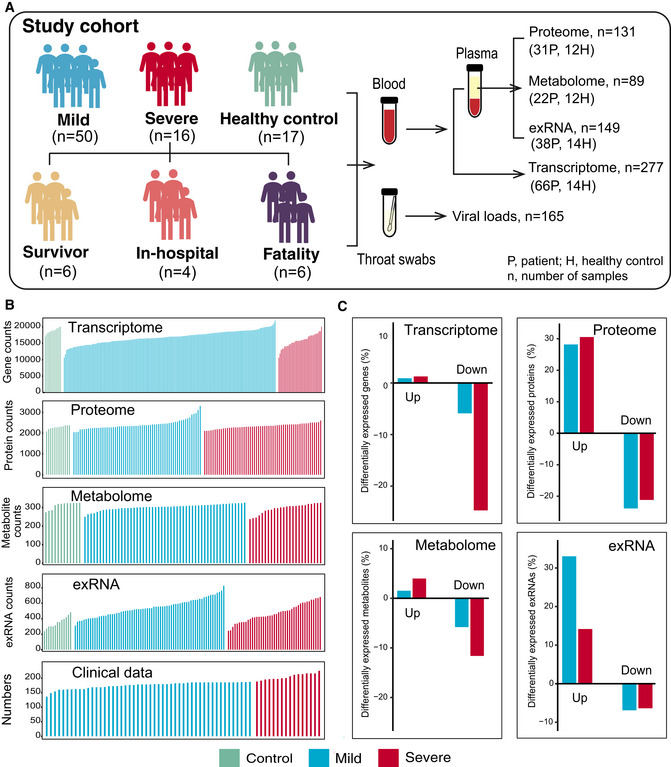
Figure 1. Study design and patient cohort.

- Schematic summary of the study design and patient cohort. Both blood and throat swabs were collected in different timepoint (1 to 5). Not all samples were analyzed in all omics approach due to different requirements of sample quality and amounts for different approach. The sample numbers for each omics data set were shown, and specific sampling time for each sample in each data set was listed in Dataset EV1.
- The number of expressed genes and detected proteins, metabolites, exRNAs, and clinical parameters in high‐quality patient samples.
- Summary of differentially expressed genes, proteins, metabolites, and exRNAs between uninfected controls and COVID‐19‐infected patients (mild and severe) in the multi‐omics data. Y‐axis showed the proportion of upregulated/downregulated genes, proteins, metabolites, and exRNAs in those that were detected in total.
