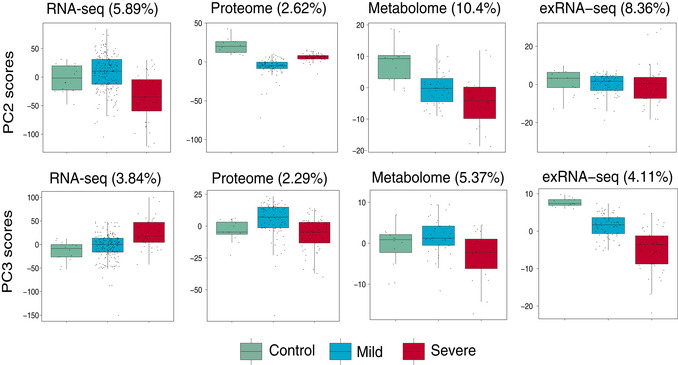
Figure EV1. Scores of principal components 2 and 3 (PC2 and PC3) of each sample from the RNA‐seq, proteome, metabolome, and exRNA‐seq principal component analyses.

For RNA‐seq: control, n = 14; mild, n = 179; severe, n = 37; For proteome, control, n = 12; mild, n = 80; severe, n = 57; For metabolome, control, n = 12; mild, n = 42; severe, n = 20; For exRNA‐seq: control, n = 14; mild, n = 179; severe, n = 37. The horizontal box lines in the boxplots represent the first quartile, the median, and the third quartile. Whiskers denote the range of points within the first quartile − 1.5 × the interquartile range and the third quartile + 1.5 × the interquartile range.
