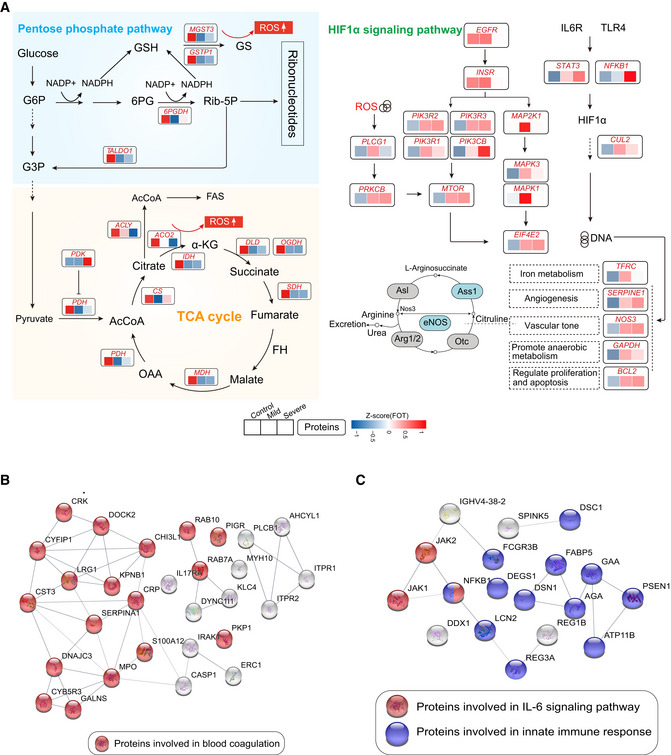
Systematic summary of the proteins and signaling cascades significantly altered in healthy control patients (TCA, PEP) and in mild or severe patients (HIF‐1α). Values for each protein in all samples analyzed (columns) are color‐coded based on expression levels: low (blue) and high (red) z‐scored FOT. Blue and gray circles present proteins that could and could not be detected in this study, respectively; eNOS, endothelial nitric oxide synthase; OTC, Ornithine carbamoyltransferase, mitochondrial; Asl, argininosuccinate lyase; Ass1, argininosuccinate synthase; Arg1/2, arginase‐1/‐2.

