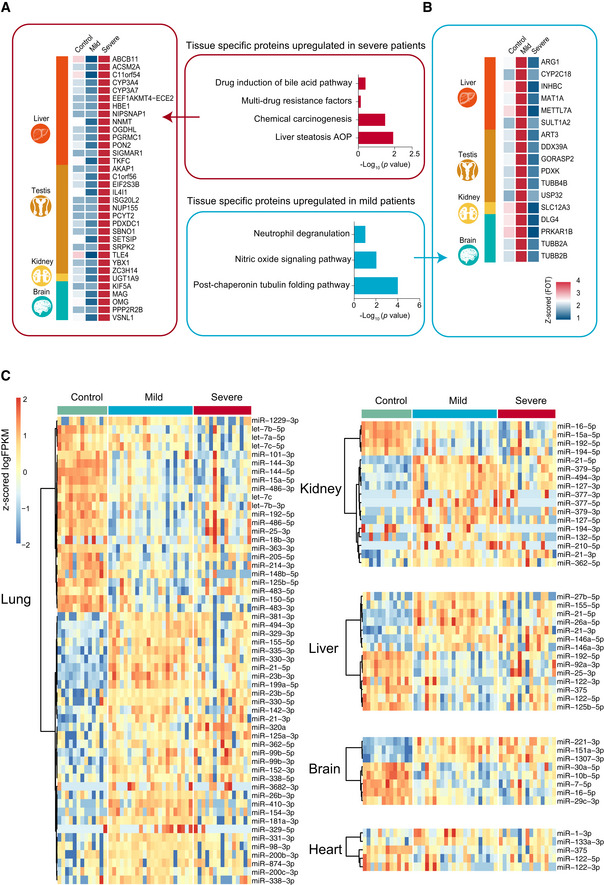
Figure EV3. Comparative analysis of tissue injury in mild and severe COVID‐19‐infected patients.

-
A, BThe heatmap indicates expression patterns of tissue‐enhanced biomarkers among the healthy control, mild, and severe patient groups. (A), tissue‐enhanced proteins upregulated in severe patients; (B), tissue‐enhanced proteins upregulated in mild patients. Values for each protein in all samples analyzed (columns) are color‐coded based on expression levels: low (blue) and high (red) z‐scored FOT. The bar plots indicate GO processes and pathways enriched by tissue‐specific proteins upregulated in mild patients (A) and severe patients (B) (Fisher’s exact test, P < 0.05).
-
CexRNA data related to tissue injury were collected from publications. The majority of tissue injury‐related exRNAs across all tissues analyzed showed differential expression. Differentially expressed exRNAs were identified using a t‐test < 0.05 and fold change> 2 or < 0.5.
