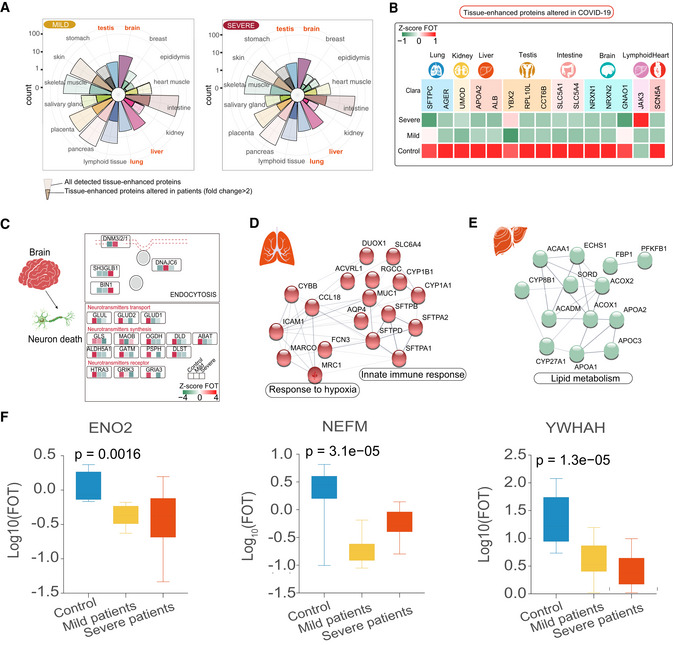
Rose plots indicating the number of all detected and differently expressed tissues‐enhanced proteins in mild (left) and severe patients (right) compared with healthy controls. Tissues labeled in orange represented tissues with the largest proportions (100% of all detected tissue‐enhanced proteins) of altered tissues‐enhanced proteins.
Heatmap indicating expression patterns of proteins related to organ function among control, mild, and severe patient groups. Values for each protein in three groups (rows) are color‐coded based on expression levels: low (green) and high (red) z‐scored FOT.
Systematic summary of brain‐enhanced expressed proteins and signaling cascades significantly altered in COVID‐19‐infected patients (neurotransmitters transport, synthesis). Values for each protein at all analyzed samples (columns) are color‐coded based on the expression levels: low (green) and high (red) z‐scored FOT.
Network summarizing lung‐enhanced expressed proteins and signaling cascades significantly altered in COVID‐19‐infected patients (HIF‐1α signaling pathway).
Network summarizing liver‐enhanced expressed proteins and signaling cascades significantly altered in COVID‐19‐infected patients (Lipid metabolism).
Boxplots indicating the expression level of known brain dysfunctional biomarkers in control (n = 12), mild (n = 13), and severe (n = 18) patients. Differences between groups were estimated using Kruskal–Wallis test. The horizontal box lines in the boxplots represent the first quartile, the median, and the third quartile. Whiskers denote the range of points within the first quartile − 1.5 × the interquartile range and the third quartile + 1.5 × the interquartile range.