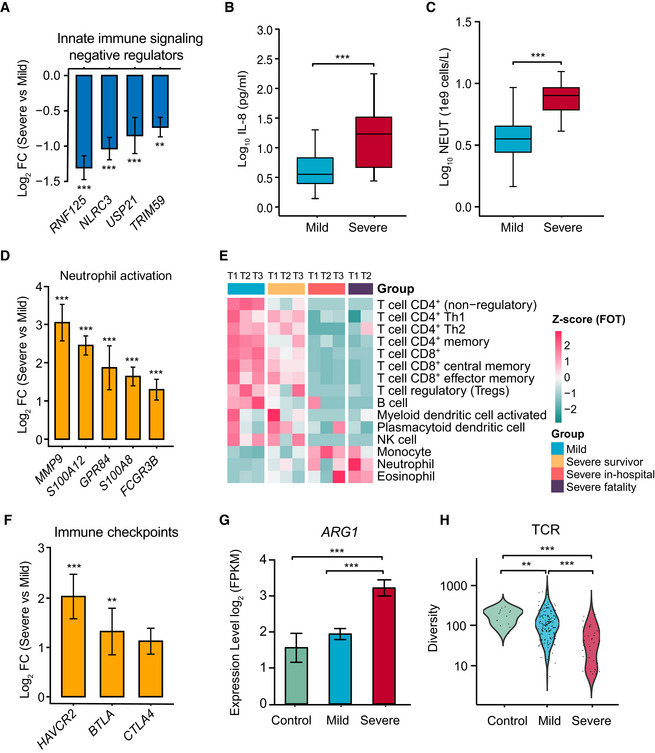
Normalized gene expression of innate immune signaling negative regulators in mild versus severe COVID‐19‐infected patient comparisons. Mild, n = 179; severe, n = 37. Differences between groups were estimated using Student’s t‐test. **P < 0.01; ***P < 0.001.
Level of plasma cytokines IL‐8 between mild and severe patient groups. Mild, n = 35; severe, n = 16. Differences between groups were estimated using Student’s t‐test. ***P < 0.001. The horizontal box lines in the boxplots represent the first quartile, the median, and the third quartile. Whiskers denote the range of points within the first quartile − 1.5 × the interquartile range and the third quartile + 1.5 × the interquartile range.
Absolute neutrophil count (NEUT) between mild and severe patient groups. Mild, n = 50; severe, n = 16. Differences between groups were estimated using Student’s t‐test. ***P < 0.001. The horizontal box lines in the boxplots represent the first quartile, the median, and the third quartile. Whiskers denote the range of points within the first quartile − 1.5 × the interquartile range and the third quartile + 1.5 × the interquartile range.
Normalized expression of neutrophil activation genes in mild versus severe COVID‐19‐infected patient comparisons. Mild, n = 179; severe, n = 37. Data were represented as means ± SEM. Differences between groups were estimated using Student’s t‐test. ***P < 0.001.
Cell type enrichment analysis of the RNA sequencing data using the X‐Cell tool among COVID‐19‐infected patient subgroups from longitudinal samples. The colors of the heatmap represent the Z‐scaled values of fractions of each cell type from different stages and subgroups. The red color stands for a higher proportion whereas the blue color denotes a lower cell population.
Expression levels of immune checkpoints, normalized to CD3G mild versus severe patient comparisons. Mild, n = 179; severe, n = 37. Data were represented as means ± SEM. Differences between groups were estimated using Student’s t‐test. **P < 0.01; ***P < 0.001.
Expression levels of ARG1 between control and COVID‐19‐infected patient subgroups. Control, n = 14; mild, n = 179; severe, n = 37. Data were represented as means ± SEM. Differences between groups were estimated using Student’s t‐test. ***P < 0.001.
Comparison of TCR diversity between healthy controls and COVID‐19‐infected patient subgroups. Control, n = 14; mild, n = 179; severe, n = 37. Differences between groups were estimated using Student’s t‐test. **P < 0.01; ***P < 0.001.

