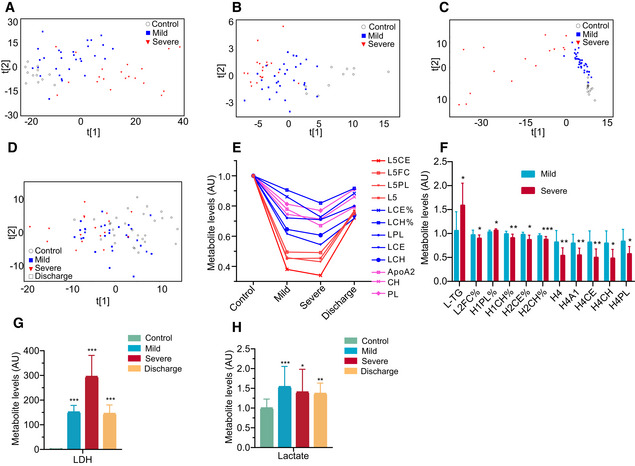
E–HCOVID‐19 severities are associated with changes in levels of the compositional components of lipoprotein subclasses (E and F), lactate (H), lactate dehydrogenase (G) in blood plasma. Data in bar plots are represented as means ± SD. Control, n = 12; mild, n = 29; severe, n = 17; discharge, n = 16; Differences between groups were estimated using Student’s t‐test. *P < 0.05; **P < 0.01; ***P < 0.001. HDL: high‐density lipoprotein; IDL: intermediate‐density lipoprotein; LDL: low‐density lipoprotein; VLDL: very low‐density lipoprotein; TG: triglycerides; FC: free cholesterol; CE: cholesteryl esters; CH: total cholesterol (i.e., FC + CE); PL: total phospholipids; L5CE, L5FC, L5PL:CE, FC and PL in LDL5; L5:LDL5; LCE, LCH: CE and CH in LDL; LCE%, LCH%: percentages of LCE and LCH in total lipids of LDL; LPL: PL in LDL; L‐TG: TG in LDL; L2FC%: percentages of L2FC (FC in LDL2) in total lipids of LDL2; H1PL%: percentages of H1PL (PL in HDL1) in total lipids of HDL1; H1CH%: percentages of H1CH (CH in HDL1) in total lipids of HDL1; H2CE%: percentages of H2CE (CE in HDL2) in total lipids of HDL2; H2CH%: percentages of H2CH (CH in HDL2) in total lipids of HDL2; H4A1, H4CE, H4CH, H4PL: ApoA1, CE, CH and PL in HDL4; AU: The metabolite concentration of each sample was normalized using the average of the control group; LDH: lactate dehydrogenase.

