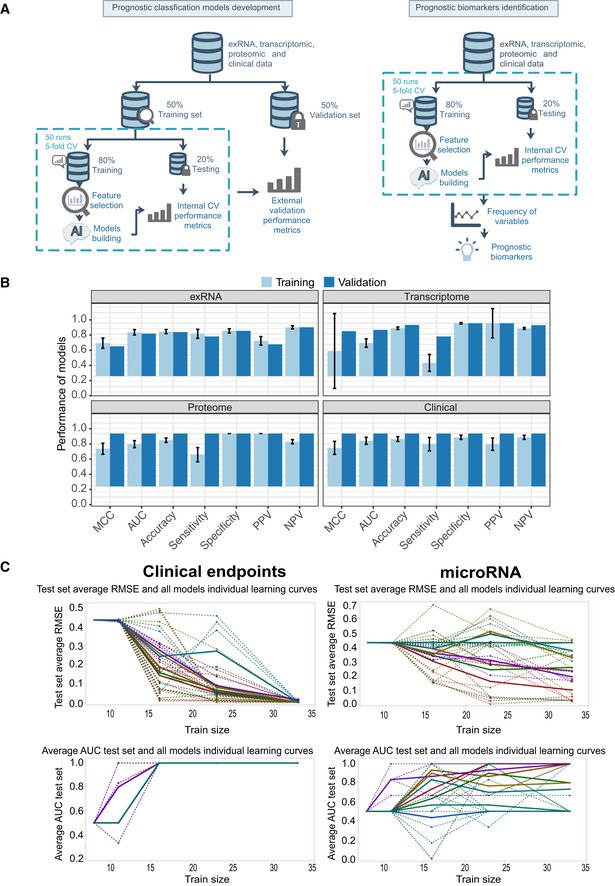
Figure EV6. Training and validation set performance in exRNA‐, transcriptome‐, proteome‐, and clinical‐ models.

- Workflow of prediction model construction.
- Performance of AI models in the training and validation set based on exRNA (n = 37), transcriptome (n = 63), proteome (n = 31), and the corresponding clinical covariate data sets (n = 37). Data are represented as means ± SD.
- Learning curve model comparison (LCMC) revealing sample size effects on the accuracy and variability of the predictive models using cross‐validation. Each individual root means square error (RMSE) learning curve and the average for each of 8 models is shown. Each color represents a model. A solid line represents the average for each model, whereas a dashed line represents one random iteration for each model.
