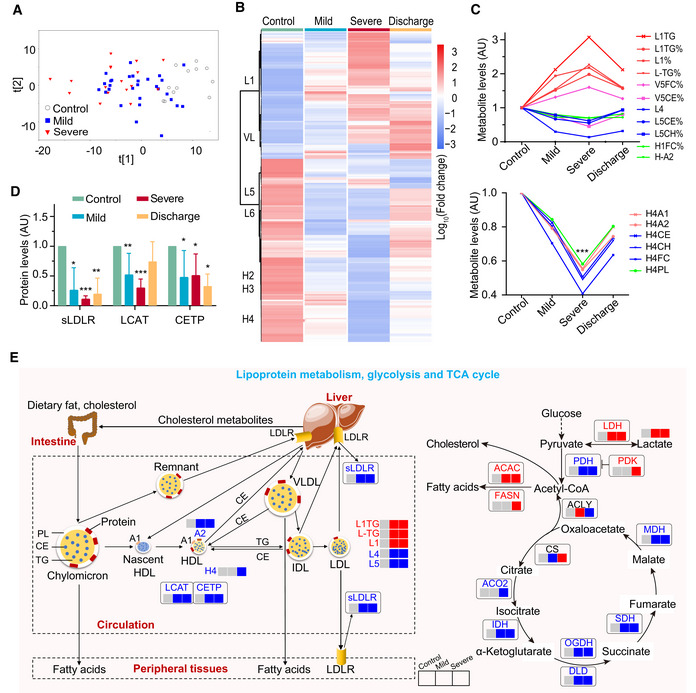
Plasma metabolomic changes revealed a trajectory in COVID‐19 severity, from healthy control (n = 12), mild (n = 29), to severe (n = 17).
Changes in the concentration of plasma metabolites are associated with COVID‐19 severity. The discharge group consist of all patients (mild and severe) that were recovered and discharged. L1, low‐density lipoprotein subclass‐1 (LDL1); VL, very low‐ density lipoprotein (VLDL); L5, LDL5; L6, LDL6; H2: high‐density lipoprotein subclass‐2 (HDL2); H3: HDL3; H4: HDL4.
COVID‐19 severity is associated with significant changes in lipoprotein subclasses including high‐density lipoprotein subclass‐1 (HDL1), HDL4, low‐density lipoprotein subclasses (LDL1, LDL4, LDL5), very low‐density lipoprotein subclass‐5 (VLDL5), and their compositional components (ApoA1, triglycerides, cholesterol). TG: triglycerides; FC: free cholesterol; CE: cholesteryl esters; CH: total cholesterol (i.e., FC + CE); PL: total phospholipids; A1: ApoA1; A2: ApoA2; L1TG: TG in LDL1; L1TG%: percentages of L1TG in total lipids of LDL1; L1%: percentage of LDL1 in all LDL; L‐TG%: percentages of L‐TG(TG in LDL) in total lipids of LDL; V5FC%, V5CE%: percentages of V5FC(FC in VLDL5) and V5CE(CE in VLDL5) in total lipids of VLDL5; L5CE%, L5CH%: percentages of L5CE(CE in LDL5) and L5CH(CH in LDL5) in total lipids of LDL5; H1FC%: percentages of H1FC (FC in HDL1) in total lipids of HDL1; H‐A2: ApoA2 in both HDL and nascent HDL; H4A1, H4A2, H4CE, H4CH, H4FC, H4PL: ApoA1, ApoA2, CE, CH, FC, and PL in HDL4.
Plasma levels of key enzymes and proteins directly involving lipoprotein metabolism are indicators for COVID‐19 severity. Data were represented as means ± SD and differences between groups were estimated using Student’s t‐test. *P < 0.05; **P < 0.01; ***P < 0.001. Control, n = 12; mild, n = 29; severe, n = 17; discharge, n = 16; sLDLR: soluble low‐density lipoprotein receptor; LCAT: lecithin‐cholesterol acyltransferase; CEPT: cholesteryl‐ester transfer protein.
COVID‐19 caused dysregulation in lipoprotein metabolism, glycolysis, and TCA cycle. The three boxes from left to right are control, mild, and severe, in which gray means normal, blue means decrease, red means increase. CS: Citrate synthase; IDH: Isocitrate dehydrogenase; ACO2: Aconitase; OGDH: α‐ketoglutarate dehydrogenase; DLD: Dihydrolipoyl dehydrogenase; SDH: Succinic dehydrogenase; MDH: Malate dehydrogenase; PDH: Pyruvate dehydrogenase; PDK: Pyruvate dehydrogenase kinase; ACLY: ATP citrate lyase; ACAC: Acetyl coenzyme A carboxylase; FASN: Fatty acid synthetase; LDH: Lactate dehydrogenase.

