
Figure 2.
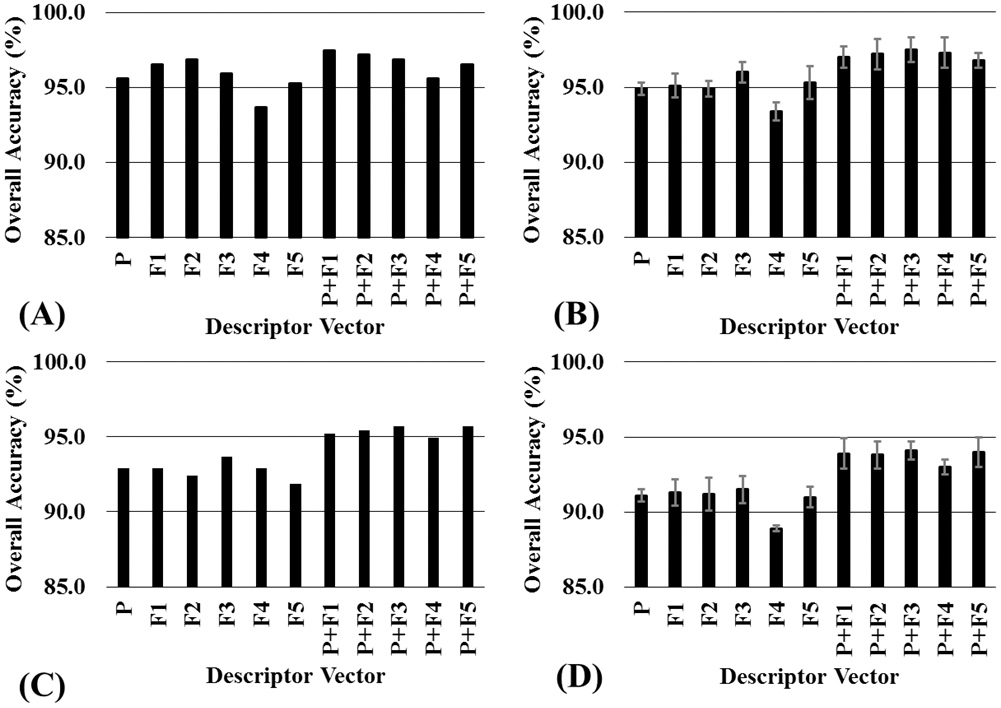
Comparison of the quality of the SVM models with different descriptor vectors in the prediction for the test set. (A) Training set included 80% compounds selected from dataset A by the KS method, and the test set included the remaining 20% compounds from dataset A. (B) Training set included 80% compounds selected from dataset A by the RS method, and the test set included the remaining 20% compounds from dataset A. The average prediction accuracy and standard deviation were caclulated from 5 independent training sets generated by the RS method (containing 80% compounds of the whole dataset). (C) Training set and test sets were selected from dataset B with the KS method. (D) The training set and test sets were selected from dataset B with the RS method.