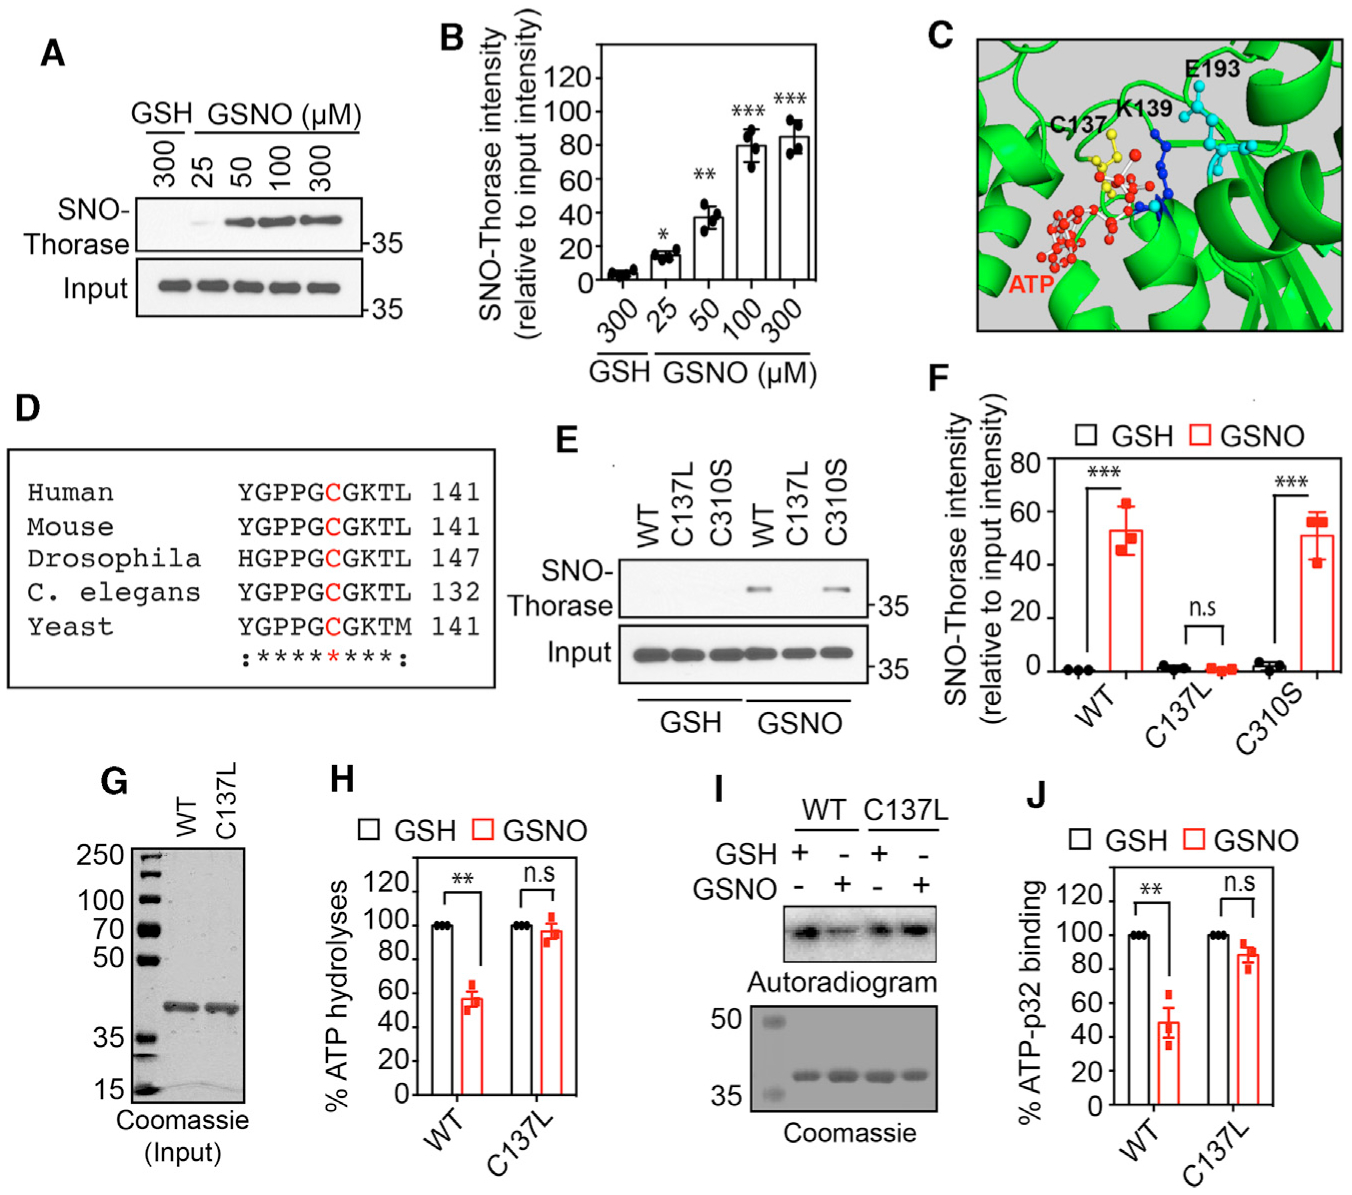
Figure 1. S-Nitrosylation of Thorase at Residue C137 Inhibits ATPase Activity.

(A) Immunoblot analyses of S-nitrosylation of Thorase with GSNO and control GSH.
(B) Graphical representation of the percentage of S-nitrosylated Thorase (n = 4, p ≤ 0.0001).
(C) A 3D model of Thorase ATPase domain showing C137, K139, and E193 location in the ATP catalytic site.
(D) Multiple alignments of Thorase (ATAD1) homologs showing conserved C137 (red text).
(E) Immunoblot analyses of S-nitrosylation of Thorase wild type (WT), C137L, and C310S.
(F) Graphical representation of the relative amount of S-nitrosylated Thorase compared to control, GSH (n = 3, p ≤ 0.0001).
(G and H) ATPase analyses of Thorase WT and C137L in the presence of GSH and GSNO (n = 4, p = 0.0002). The ATPase activity in the presence of GSH was considered 100% activity.
(I and J) ATP binding activities of Thorase WT and C137L in the presence of GSH and GSNO. GSNO inhibits WT but not C137L ATPase activity (n = 3, p = 0.0036).
Means ± standard errors of the mean (SEMs) of the experiments performed. *p < 0.10, **p < 0.05, ***p < 0.01, n.s., p > 0.10; ANOVA with Holm-Sidak post hoc test compared with WT; power: 1-β error probability = 0.9–1.0.
