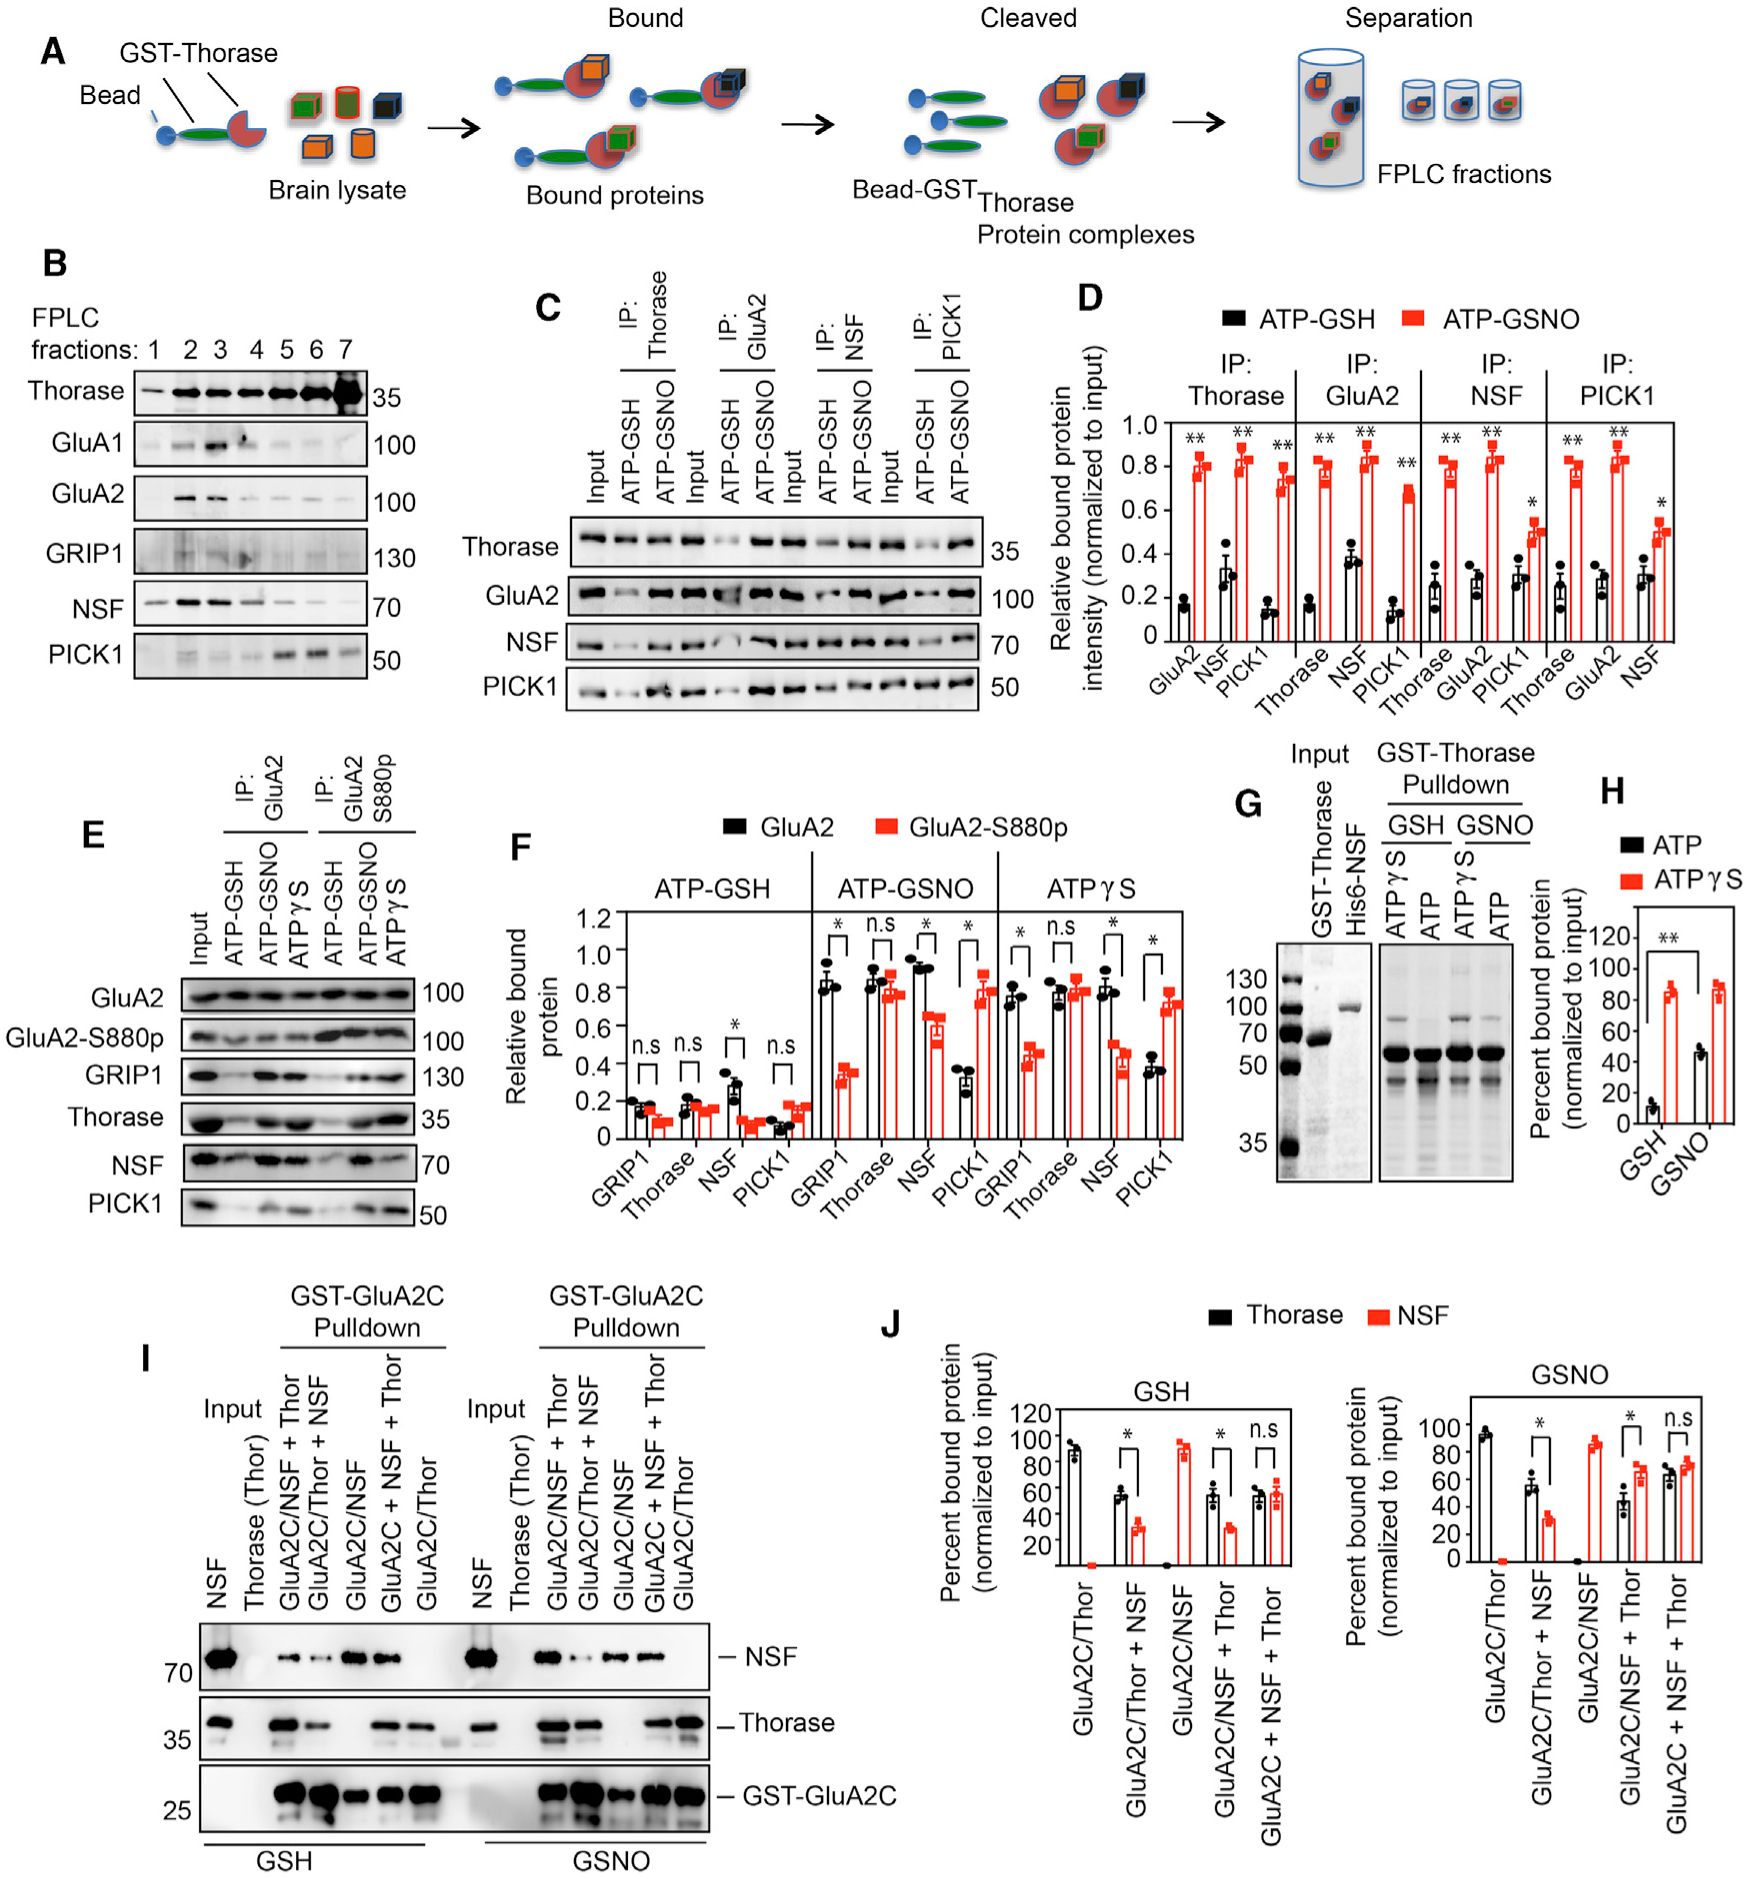
Figure 4. S-Nitrosylation-Dependent Interaction between Thorase, NSF, and PICK1.

(A) Schematic diagram of recombinant Thorase pull-down from brain lysates to identify binding partners.
(B) Immunoblots of FPLC fractions of Thorase pull-down of protein complexes.
(C) Immunoblot analyses of Thorase, GluA2, NSF, and PICK1 IP from mouse whole-brain lysates in the presence of ATP with GSH or GSNO. The samples were resolved on 10% SDS-PAGE and immunoblotted with anti-Thorase, anti-GluA2, anti-NSF, and anti-PICK1 antibodies.
(D) Normalized relative bound proteins in the IP samples (n = 3, p ≤ 0.0001).
(E) Immunoblot analyses of GluA2 and phosphorylated GluA2 (GluA2 S880p) IP from mouse whole-brain lysates in the presence of ATPγS or ATP with GSH or GSNO.
(F) Normalized relative bound proteins in the IP samples for (C) (n = 3, p ≤ 0.0001).
(G) Coomassie stained SDS-PAGE analyses of GST-Thorase pull-downs of NSF in the presence of GSNO.
(H) Percentage of NSF bound to Thorase in (G) (n = 3, p = 0.0002).
(I) Immunoblot analyses of GST-GluA2C pull-downs of Thorase and NSF in the presence of GSH or GSNO. NSF was added to the prebound GluA2-Thorase complex (GluA2/Thor + NSF), Thorase was added to the prebound GluA2-NSF complex (GluA2/NSF + Thor), or Thorase and NSF were mixed together with GluA2 (GluA2C + NSF + Thor) during the GST-GluA2C pull-down experiments.
(J) Graphical representation of percentage of bound Thorase and NSF bound to GST-GluA2C for (I) (n = 3, p = 0.0139).
Means ± SEMs of the experiments performed. *p < 0.10, **p < 0.05, n.s. p > 0.10; ANOVA with Holm-Sidak post hoc test compared with WT; power: 1-β error probability = 1.0).
