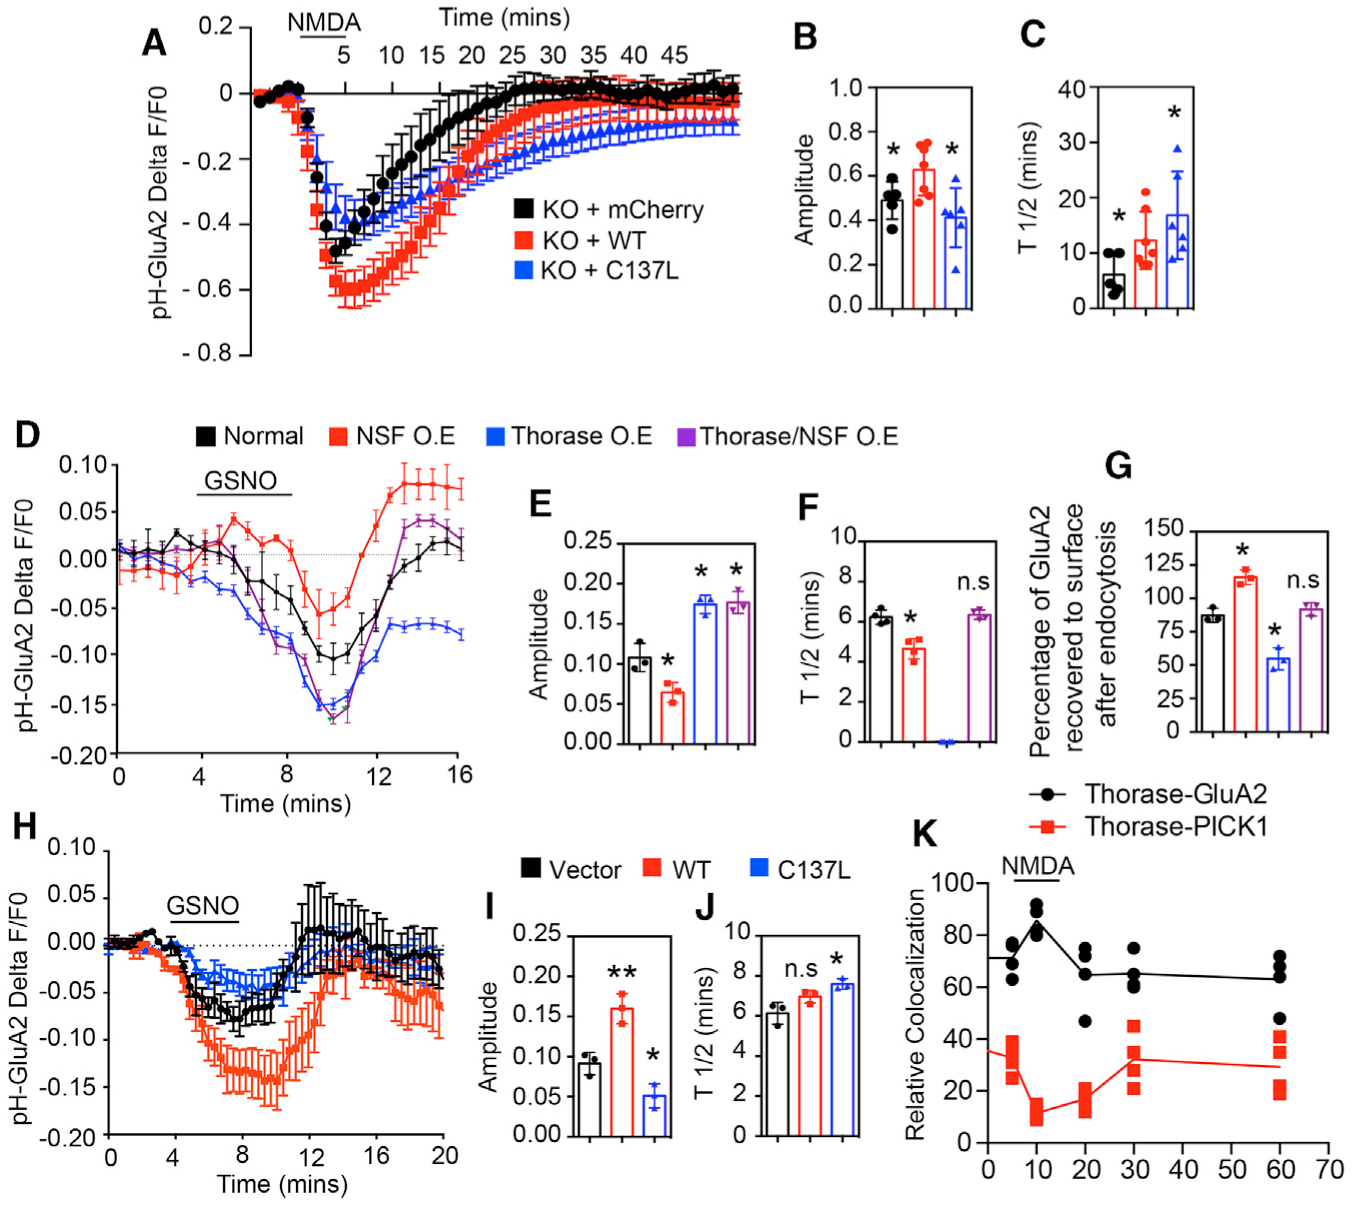
Figure 6. S-Nitrosylation of Thorase and Transnitrosylation of NSF Are Important for AMPAR-GluA2 Trafficking.

(A) Time trace of pH-GluA2 fluorescence change in response to NMDA in neurons expressing mCherry empty vector or Thorase (WT or C137L mutant).
(B) Amplitudes of fluorescence intensity changes (n = 5–7, p = 0.0367).
(C) Average recycling half-time (T1/2), the time taken from maximum endocytosis to 50% recycling (n = 5–7, p = 0.0299).
(D) Time trace of pH-GluA2 fluorescence change in response to GSNO in HEK293 cells expressing Thorase, NSF, and GRIP1.
(E) Amplitudes of fluorescence intensity changes (n = 3–4, p ≤ 0.0001).
(F) Average T1/2 (n = 3–4, p ≤ 0.0001).
(G) Percentage of pH-GluA2 fluorescence recovered after GSNO washout (n = 3–4, p ≤ 0.0001).
(H) Time trace of pH-GluA2 fluorescence change in response to GSNO in HEK293 cells expressing Thorase WT or C137L.
(I) Amplitudes of fluorescence intensity changes (n = 3, p = 0.0005).
(J) Average T1/2 (n = 3, p ≤ 0.0115).
(K) Time trace of Thorase interactions (colocalization) with GluA2 and PICK1 change in response to NMDA in neurons (n = 4, p = 0.0001).
Means ± SEMs of the experiments performed. *p < 0.10, **p < 0.05, n.s. p > 0.10; ANOVA with Holm-Sidak post hoc test compared with WT; power: 1-β error probability = 0.85–1.0).
