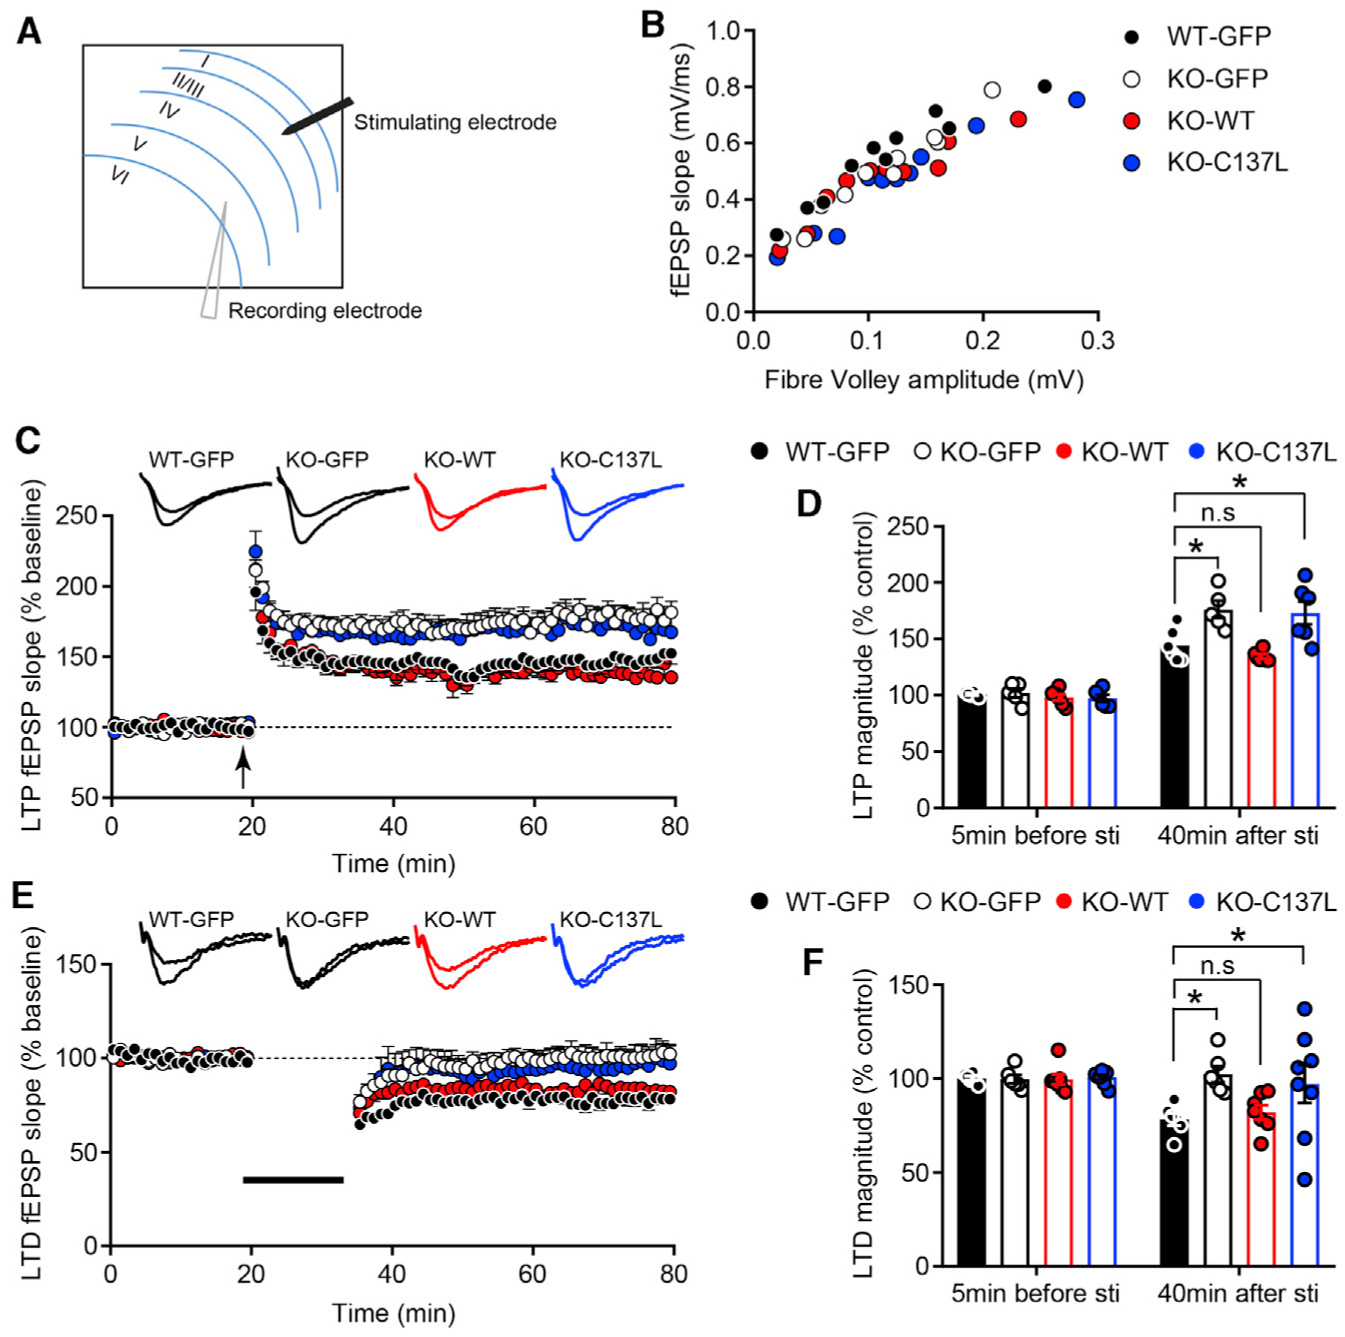
Figure 7. Thorase S-Nitrosylation-Modulated GluA2 Trafficking Is Important for Synaptic Plasticity.

(A) Schematic representation of the prelimbic (PrL) area in a coronal mPFC slice.
(B) Input-output relationships (I/O) of fEPSPs in WT-GFP, KO-GFP, KO-WT, and KO-C137L slices. Traces show representative fEPSPs obtained with different stimulus intensities.
(C) LTP expression was dramatically increased in KO-GFP and KO-C137L slices. Representative traces show fEPSPs recorded at 5 min before stimulation and 40 min after LTP induction (n = 6 slices from 6 mice; KO-GFP, n = 5 slices from 5 mice; KO-WT, n = 6 slices from 6 mice; KO-C137L, n = 6 slices from 6 mice).
(D) LTP magnitude was calculated at 5 min before and 40 min after LTP induction as a percentage of baseline responses (*p < 0.05).
(E) LTD was absent in KO-GFP and KO-C137L mouse brain slices. Representative traces show fEPSPs recorded at 5 min before stimulation and 40 min after LTD induction (n = 6 slices from 6 mice; KO-GFP, n = 6 slices from 5 mice; KO-WT, n = 7 slices from 6 mice; KO-C137L, n = 8 slices from 6 mice).
(F) LTD magnitude was quantified 40 min after low-frequency stimulation as a percentage of baseline responses.
Values are means ± SEMs, *p < 0.05, ANOVA with Holm-Sidak post hoc test compared with WT-GFP.
