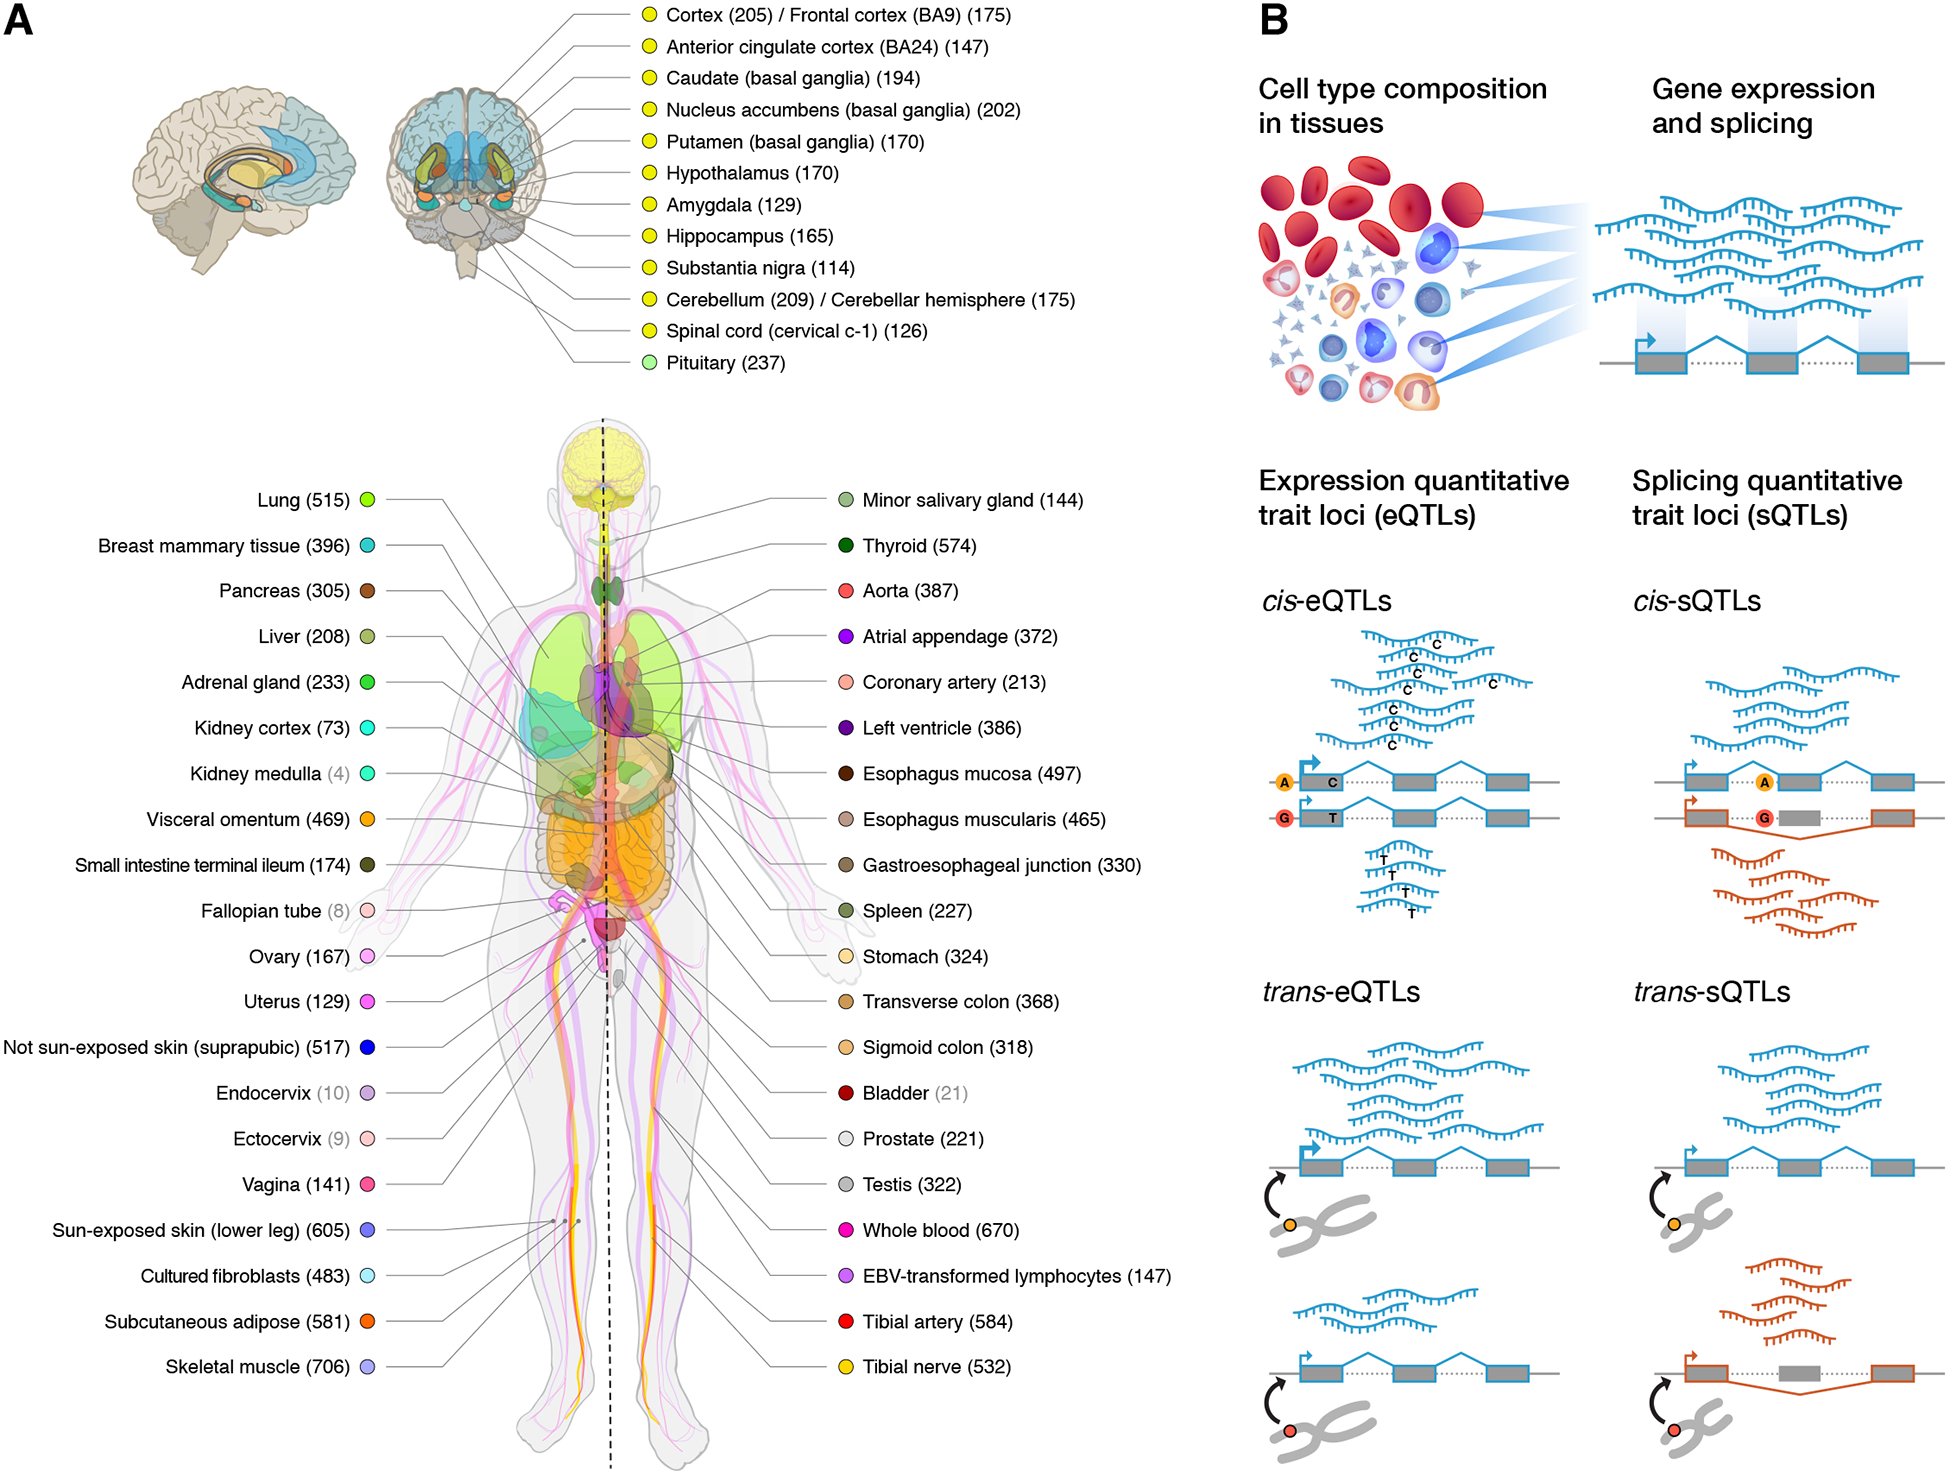
Figure 1. Sample and data types in the GTEx v8 study.

(A) Illustration of the 54 tissue types examined (including 11 distinct brain regions and 2 cell lines), with sample numbers from genotyped donors in parentheses and color coding indicated in the adjacent circles. Tissues with ≥70 samples were included in QTL analyses. (B) Illustration of the core data types used throughout the study. Gene expression and splicing were quantified from bulk RNA-seq of heterogenous tissue samples, and local and distal genetic effects (cis-QTLs and trans-QTLs, respectively) were quantified across individuals for each tissue.
